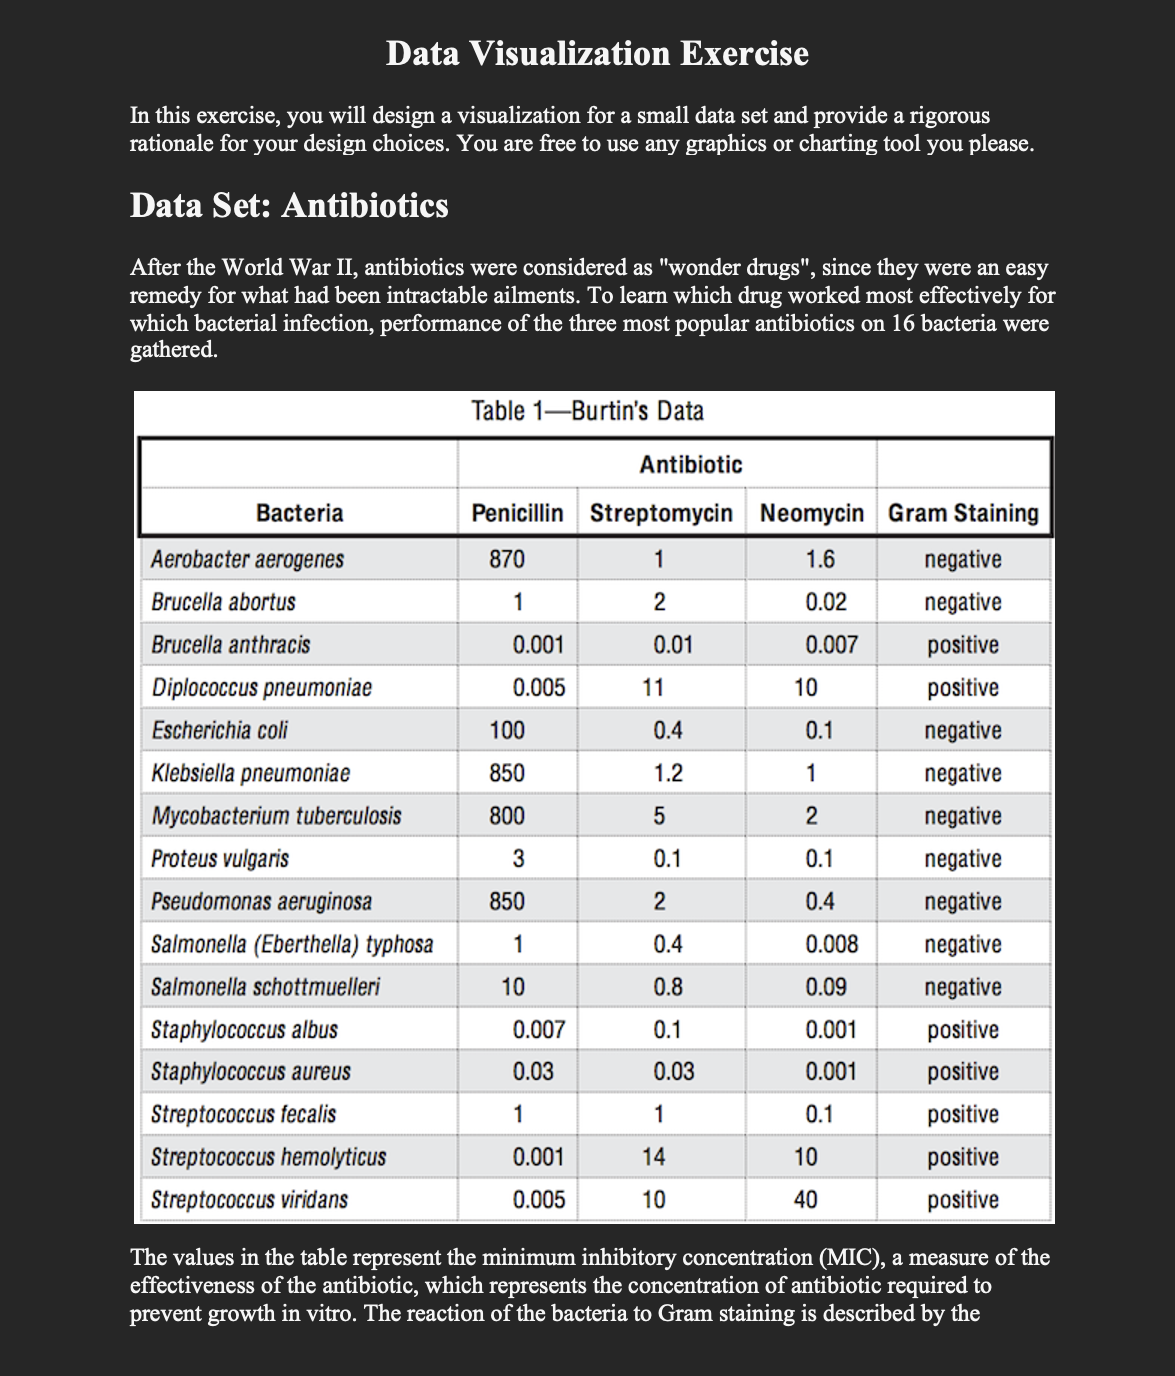
Data Visualization Exercise In this exercise, you will design a visualization for a small data set...
Fantastic news! We've Found the answer you've been seeking!
Question:
Transcribed Image Text:
Data Visualization Exercise In this exercise, you will design a visualization for a small data set and provide a rigorous rationale for your design choices. You are free to use any graphics or charting tool you please. Data Set: Antibiotics After the World War II, antibiotics were considered as "wonder drugs", since they were an easy remedy for what had been intractable ailments. To learn which drug worked most effectively for which bacterial infection, performance of the three most popular antibiotics on 16 bacteria were gathered. Bacteria Aerobacter aerogenes Brucella abortus Brucella anthracis Diplococcus pneumoniae Escherichia coli Klebsiella pneumoniae Mycobacterium tuberculosis Proteus vulgaris Pseudomonas aeruginosa Salmonella (Eberthella) typhosa Salmonella schottmuelleri Staphylococcus albus Staphylococcus aureus Streptococcus fecalis Streptococcus hemolyticus Streptococcus viridans Table 1-Burtin's Data Penicillin Streptomycin 870 1 1 2 0.01 0.001 0.005 100 850 800 3 850 1 10 Antibiotic 0.007 0.03 1 0.001 0.005 11 0.4 1.2 5 0.1 2 0.4 0.8 0.1 0.03 1 14 10 Neomycin Gram Staining 1.6 0.02 0.007 10 0.1 1 2 0.1 0.4 0.008 0.09 0.001 0.001 0.1 10 40 negative negative positive positive negative negative negative negative negative negative negative positive positive positive positive positive The values in the table represent the minimum inhibitory concentration (MIC), a measure of the effectiveness of the antibiotic, which represents the concentration of antibiotic required to prevent growth in vitro. The reaction of the bacteria to Gram staining is described by the covariate "gram staining". Bacteria that are stained dark blue or violet are Gram-positive. Otherwise, they are Gram-negative. Task Your task is to design a static (i.e., single chart image) visualization that you believe effectively communicates the data. While you must use the data set given, note that you are free to transform the data as you see fit. Your chart image should be interpretable without recourse to a write-up. Do not forget to include title, axis labels or legends as needed! Data Visualization Exercise In this exercise, you will design a visualization for a small data set and provide a rigorous rationale for your design choices. You are free to use any graphics or charting tool you please. Data Set: Antibiotics After the World War II, antibiotics were considered as "wonder drugs", since they were an easy remedy for what had been intractable ailments. To learn which drug worked most effectively for which bacterial infection, performance of the three most popular antibiotics on 16 bacteria were gathered. Bacteria Aerobacter aerogenes Brucella abortus Brucella anthracis Diplococcus pneumoniae Escherichia coli Klebsiella pneumoniae Mycobacterium tuberculosis Proteus vulgaris Pseudomonas aeruginosa Salmonella (Eberthella) typhosa Salmonella schottmuelleri Staphylococcus albus Staphylococcus aureus Streptococcus fecalis Streptococcus hemolyticus Streptococcus viridans Table 1-Burtin's Data Penicillin Streptomycin 870 1 1 2 0.01 0.001 0.005 100 850 800 3 850 1 10 Antibiotic 0.007 0.03 1 0.001 0.005 11 0.4 1.2 5 0.1 2 0.4 0.8 0.1 0.03 1 14 10 Neomycin Gram Staining 1.6 0.02 0.007 10 0.1 1 2 0.1 0.4 0.008 0.09 0.001 0.001 0.1 10 40 negative negative positive positive negative negative negative negative negative negative negative positive positive positive positive positive The values in the table represent the minimum inhibitory concentration (MIC), a measure of the effectiveness of the antibiotic, which represents the concentration of antibiotic required to prevent growth in vitro. The reaction of the bacteria to Gram staining is described by the covariate "gram staining". Bacteria that are stained dark blue or violet are Gram-positive. Otherwise, they are Gram-negative. Task Your task is to design a static (i.e., single chart image) visualization that you believe effectively communicates the data. While you must use the data set given, note that you are free to transform the data as you see fit. Your chart image should be interpretable without recourse to a write-up. Do not forget to include title, axis labels or legends as needed!
Expert Answer:
Related Book For
Microeconomics An Intuitive Approach with Calculus
ISBN: 978-0538453257
1st edition
Authors: Thomas Nechyba
Posted Date:
Students also viewed these human resource management questions
-
Explain the investigation process As an HR manager, identify the first three steps you recommend the HR team take to begin to investigate this scenario. Explain how the steps you are recommending are...
-
Consider the difference between empirical scientific evidence and anecdotal evidence, then: Discuss which is considered more useful to the study of public policy and state why.
-
Suppose a recent and widely circulated medical article has reported new benefits of cycling for exercise. Simultaneously, the price of the parts needed to make bikes falls. If the change in supply is...
-
On February 16, 2005, Joseph and Margaret Buset borrowed $192,000 from Fremont Investment & Loan (the Originator). The loan was secured by a mortgage on a residential condominium. The mortgage named...
-
The intangible assets section of Cepeda Corporations balance sheet at December 31, 2012, is presented here. Patents ($60,000 cost less $6,000 amortization) ..... $54,000 Copyrights ($36,000 cost less...
-
Commencing 1 April 2022, Morgan Landscaping Pty Ltd (morgan) provided Larissa (an employee) with the use of a Volkswagen Golf car. The car cost $55,000 (including GST) and was used privately every...
-
State true or false. Metadata is a subset of data that is most recently entered.
-
ABC company is interested in forecasting quarterly sales for year 2017 for one of its products. Based on past 3 years of quarterly sales data (2014, 2015, and 2016), two forecasting methods look...
-
Describe types of disallowed deductions and losses on related party transactions.
-
A model to explain the per acre yield of grain uses rain fall, temperature, length of growing cycle in weeks, and four types of fertilizer used. Write the equation that would be used to estimate...
-
How do corporations treat start-up expenditures?
-
CX Enterprises has the following expected dividends: $1.08 in one year, $1.18 in two years, and $1.27 in three years. After that, its dividends are expected to grow at 4.1% per year forever (so that...
-
Sketch the expected charge versus pH curve for humic substances. How does this differ from a pure compound with one functional group such as acetic acid? You should make reference to the key...
-
Briefly describe the following types of group life insurance plans: a. Group term life insurance b. Group accidental death and dismemberment insurance (AD&D) c. Group universal life insurance d....
-
Business Taxes: In this exercise, suppose that your hamburger business McWendys has a homothetic decreasing returns to scale production function that uses labor and capital k to produce hamburgers x...
-
In this exercise, assume the same set-up as in exercise 15.3 except that this time we will assume that hamburgers are a nor- mal good for all consumers. A: As in exercise 15.3, well consider the long...
-
Mergers and Antitrust Policy in Related Product Markets: In exercise 26.1, we investigated different ways in which the markets for good xi (produced by firm i) and good xj (produced by firm j) may be...
-
Discuss how a new brand manufacturer would go about defining their market segments and then begin to target them.
-
Go to www.kellogs.com, and examine the brands offered by Kelloggs. Using the BCG growth-share matrix, classify 10 brands as stars, question marks, cash cows, or dogs. Find at least one product you...
-
Diff Eyewear is a successful business built around a socially conscious mission. The company makes and sells stylish eyewear with comparable quality but a significantly lower price than luxury...
Study smarter with the SolutionInn App