

Question: Assignment 4 (Tableau 1) This Tableau file contains information on all U.S. airline flights from 2010 and 2011. Using Tableau, answer each of the following
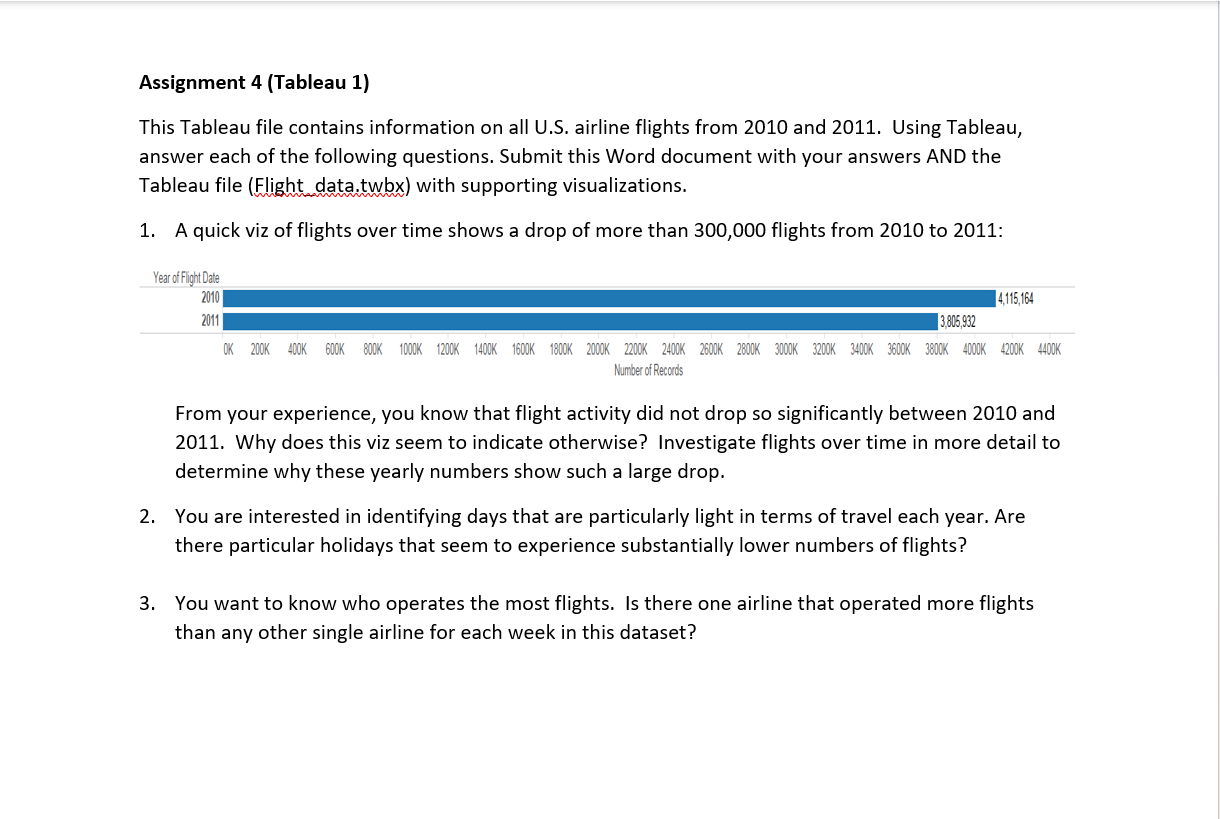
Assignment 4 (Tableau 1) This Tableau file contains information on all U.S. airline flights from 2010 and 2011. Using Tableau, answer each of the following questions. Submit this Word document with your answers AND the Tableau file (Flight data.twbx) with supporting visualizations. 1. A quick viz of flights over time shows a drop of more than 300,000 flights from 2010 to 2011: Year of Flight Date 2010 4,115,164 2011 3,805,932 OK 200K 40OK 600K 800K 1000K 1200K 1400K 1600K 1800K 2000K 2200K 2400K 2600K 2800K 3000K 320OK 340OK 360OK 3800K 4000K 420OK 440OK Number of Records From your experience, you know that flight activity did not drop so significantly between 2010 and 2011. Why does this viz seem to indicate otherwise? Investigate flights over time in more detail to determine why these yearly numbers show such a large drop. 2. You are interested in identifying days that are particularly light in terms of travel each year. Are there particular holidays that seem to experience substantially lower numbers of flights? 3. You want to know who operates the most flights. Is there one airline that operated more flights than any other single airline for each week in this dataset
Step by Step Solution
There are 3 Steps involved in it

Get step-by-step solutions from verified subject matter experts