

Question: The Flights_data.twbx Tableau file contains information on all U.S. airline flights from 2010 and 2011. Create a Tableau workbook to answer each of the
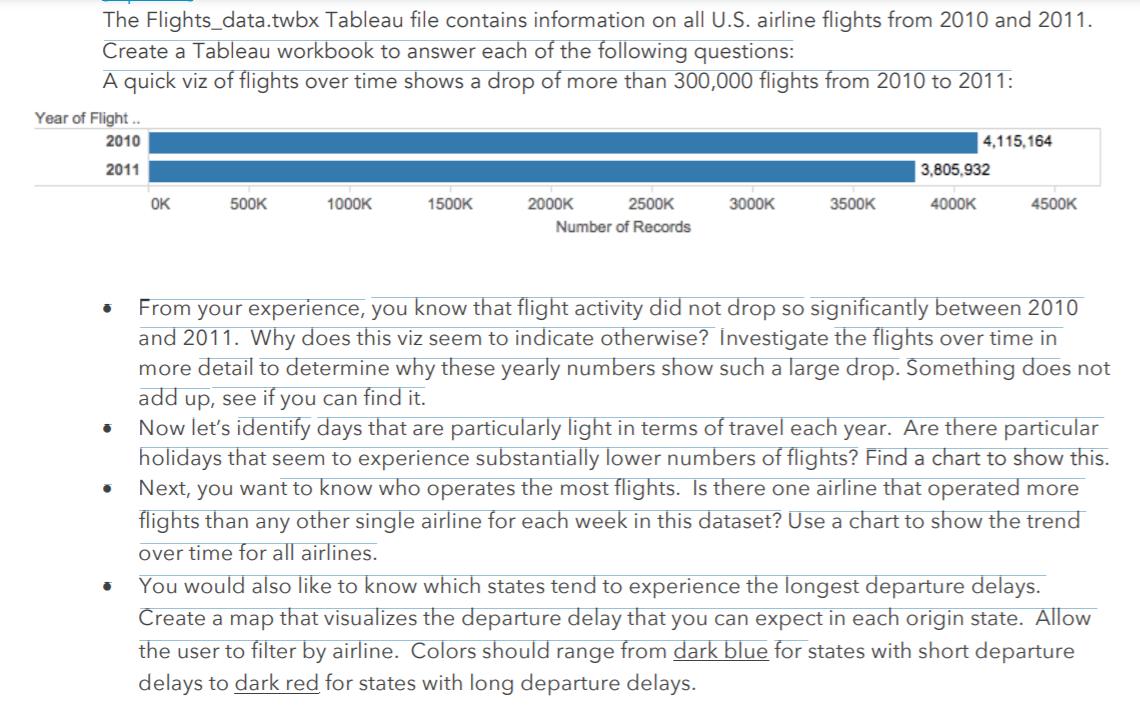
The Flights_data.twbx Tableau file contains information on all U.S. airline flights from 2010 and 2011. Create a Tableau workbook to answer each of the following questions: A quick viz of flights over time shows a drop of more than 300,000 flights from 2010 to 2011: Year of Flight. 2010 4,115,164 2011 3,805,932 OK 500K 1000K 1500K 2000K 2500K 3000K 3500K 4000K 4500K Number of Records From your experience, you know that flight activity did not drop so significantly between 2010 and 2011. Why does this viz seem to indicate otherwise? nvestigate the flights over time in more detail to determine why these yearly numbers show such a large drop. Something does not add up, see if you can find it. Now let's identify days that are particularly light in terms of travel each year. Are there particular holidays that seem to experience substantially lower numbers of flights? Find a chart to show this. Next, you want to know who operates the most flights. Is there one airline that operated more flights than any other single airline for each week in this dataset? Use a chart to show the trend over time for all airlines. You would also like to know which states tend to experience the longest departure delays. Create a map that visualizes the departure delay that you can expect in each origin state. Allow the user to filter by airline. Colors should range from dark blue for states with short departure delays to dark red for states with long departure delays.
Step by Step Solution
3.54 Rating (164 Votes )
There are 3 Steps involved in it

Get step-by-step solutions from verified subject matter experts