

Question: Assignment: Flights Data This Tableau file contains information on all U . S . airline flights from 2 0 1 0 and 2 0 1
Assignment: Flights Data
This Tableau file contains information on all US airline flights from and Create a Tableau worksheet to answer each of the following questions:
FILE to use: Flightsdata.twbx from the Public Files on your Moodle site.
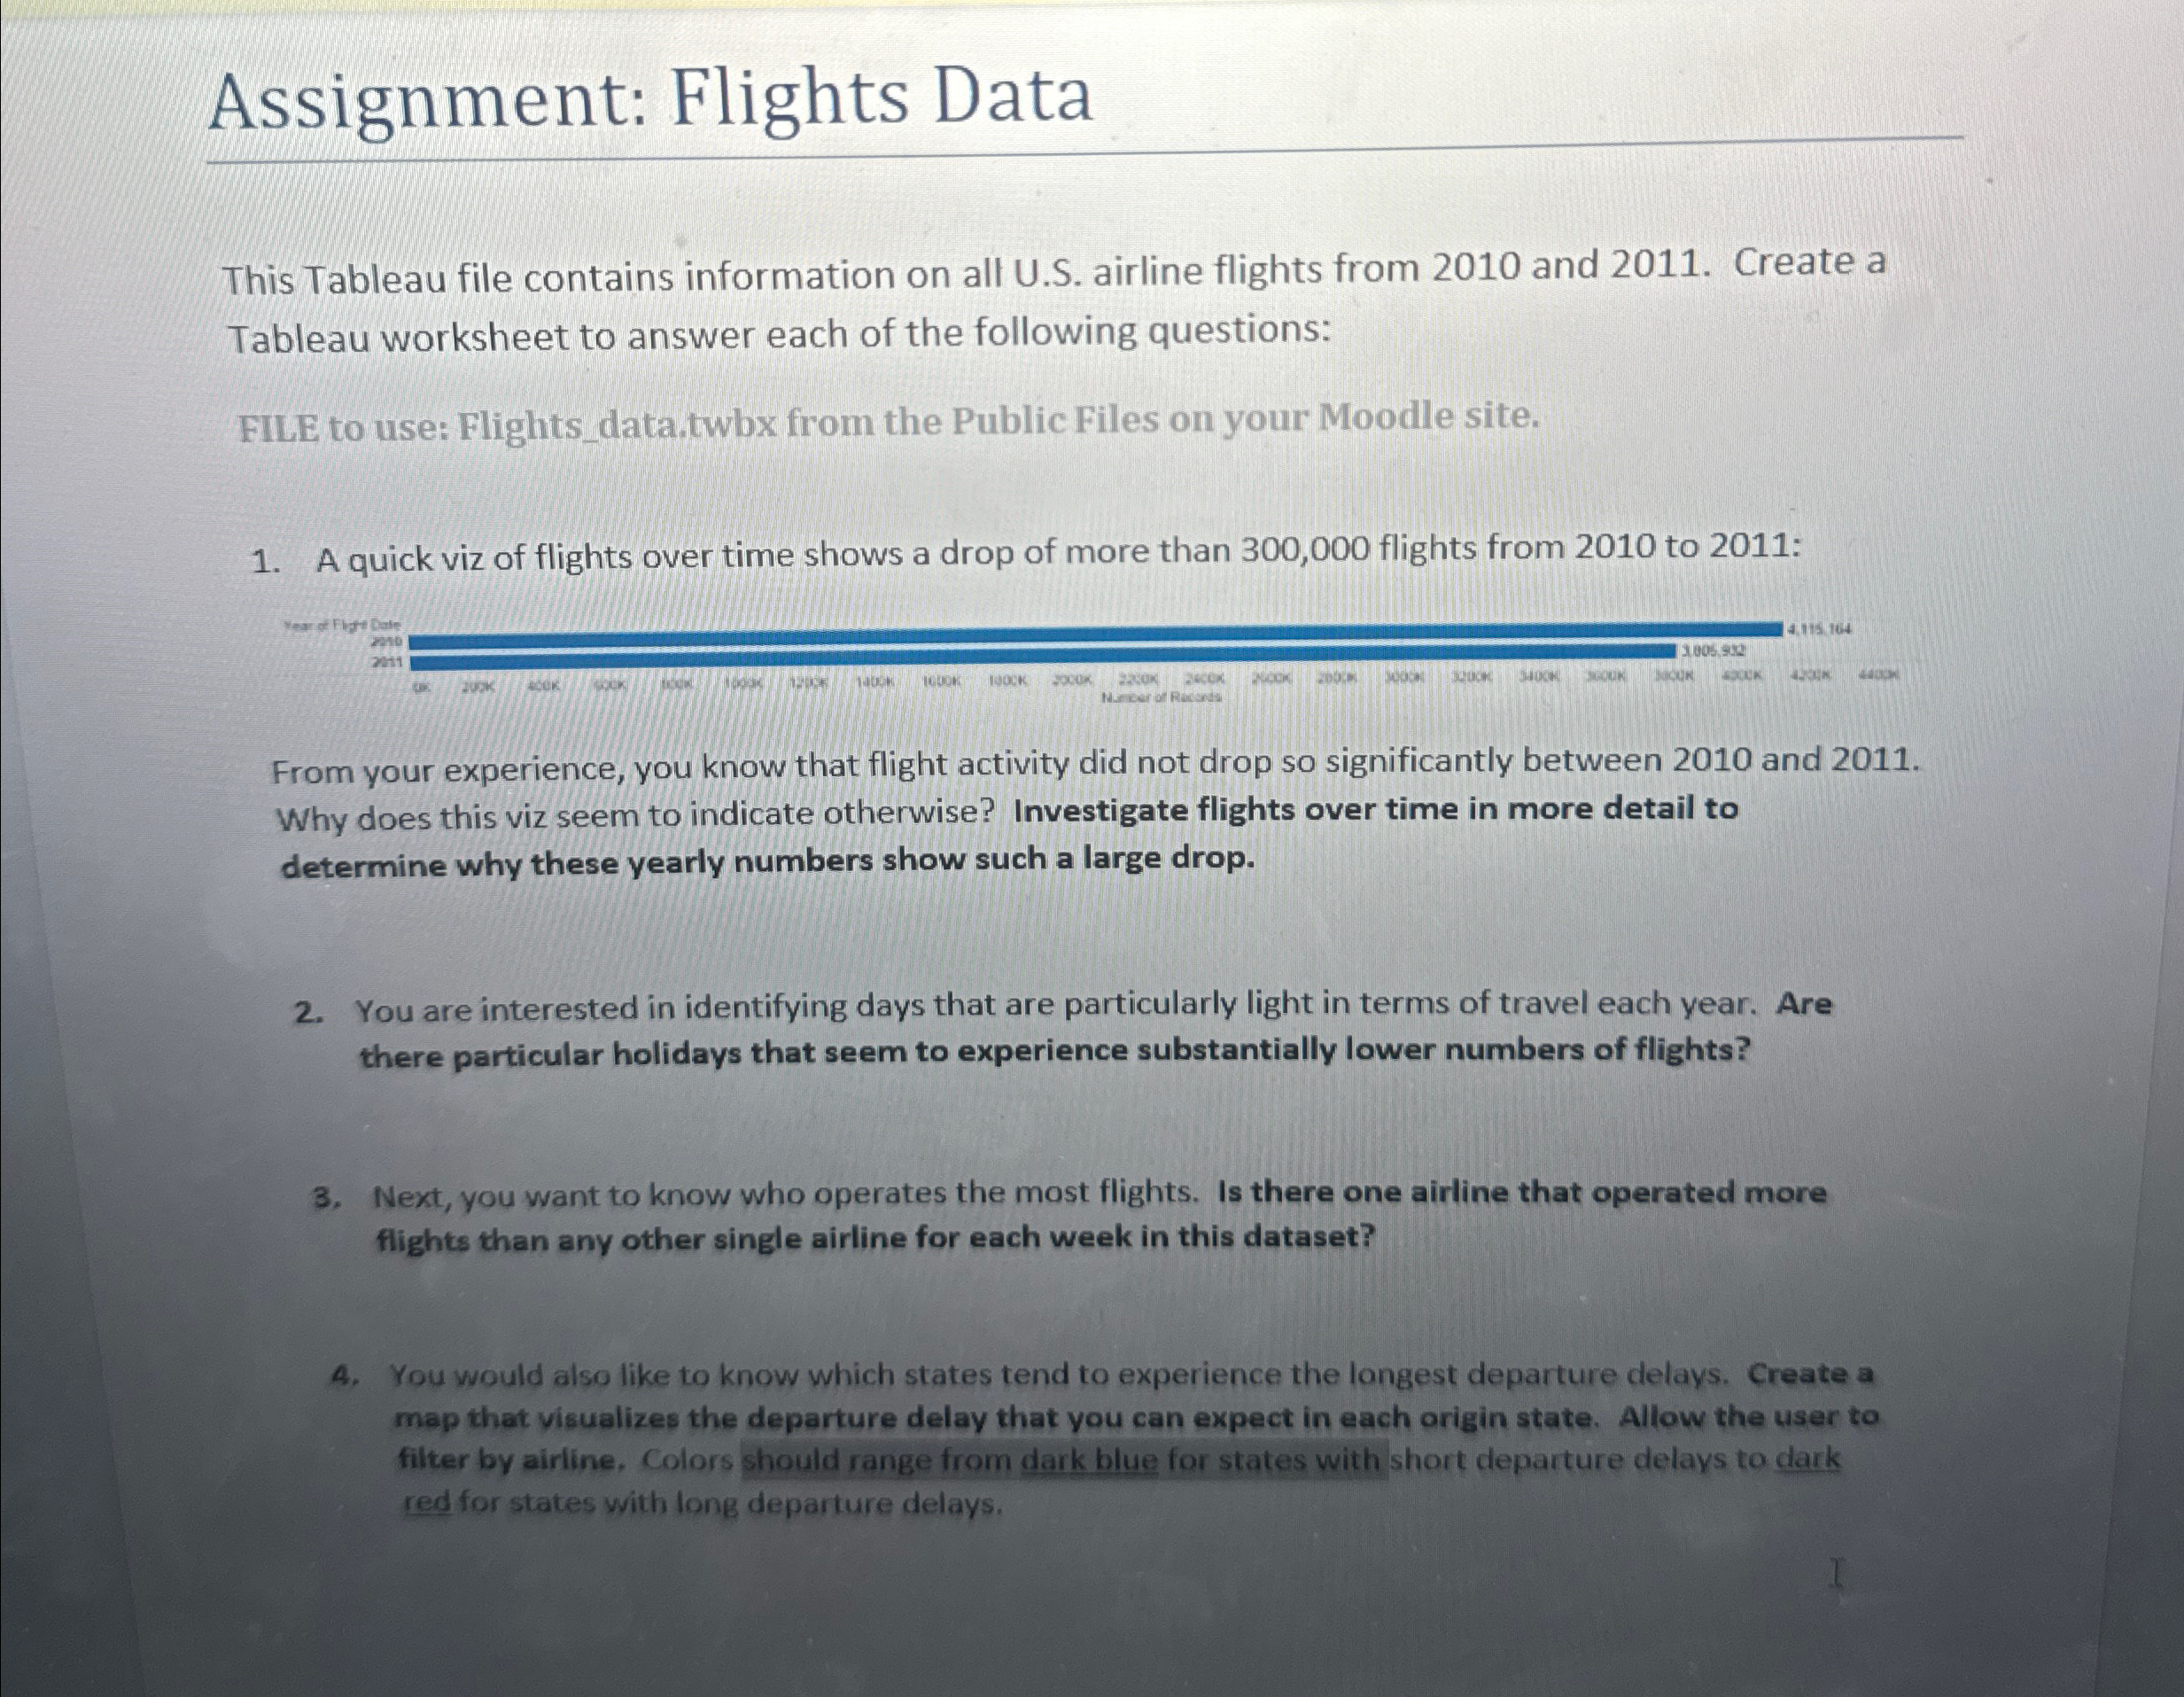
A quick viz of flights over time shows a drop of more than flights from to :
From your experience, you know that flight activity did not drop so significantly between and Why does this viz seem to indicate otherwise? Investigate flights over time in more detail to determine why these yearly numbers show such a large drop.
You are interested in identifying days that are particularly light in terms of travel each year. Are there particular holidays that seem to experience substantially lower numbers of flights?
Next, you want to know who operates the most flights. Is there one airline that operated more flights than any other single airline for each week in this dataset?
You would also like to know which states tend to experience the longest departure delays. Create a map that visualizes the departure delay that you can expect in each origin state. Allow the user to filter by airline, Colors should range from dark blue for states with short departure delays to dark red for states with long departure delays.
Step by Step Solution
There are 3 Steps involved in it
1 Expert Approved Answer
Step: 1 Unlock

Question Has Been Solved by an Expert!
Get step-by-step solutions from verified subject matter experts
Step: 2 Unlock
Step: 3 Unlock