

Question: Assignment This assignment is to create a Gantt chart that depicts your WBS and also clearly shows 3 week time boxed iterations and the critical
Assignment
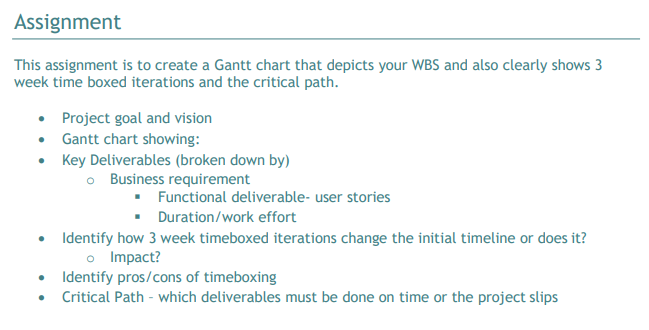
This assignment is to create a Gantt chart that depicts your WBS and also clearly shows
week time boxed iterations and the critical path.
Project goal and vision
Gantt chart showing:
Key Deliverables broken down by
Business requirement
Functional deliverable user stories
Durationwork effort
Identify how week timeboxed iterations change the initial timeline or does it
Impact?
Identify proscons of timeboxing
Critical Path which deliverables must be done on time or the project slips
Step by Step Solution
There are 3 Steps involved in it
1 Expert Approved Answer
Step: 1 Unlock

Question Has Been Solved by an Expert!
Get step-by-step solutions from verified subject matter experts
Step: 2 Unlock
Step: 3 Unlock