

Question: Assume that a randomly selected subject is given a bone density test. Those test scores are normally distributed with a mean of 0 and
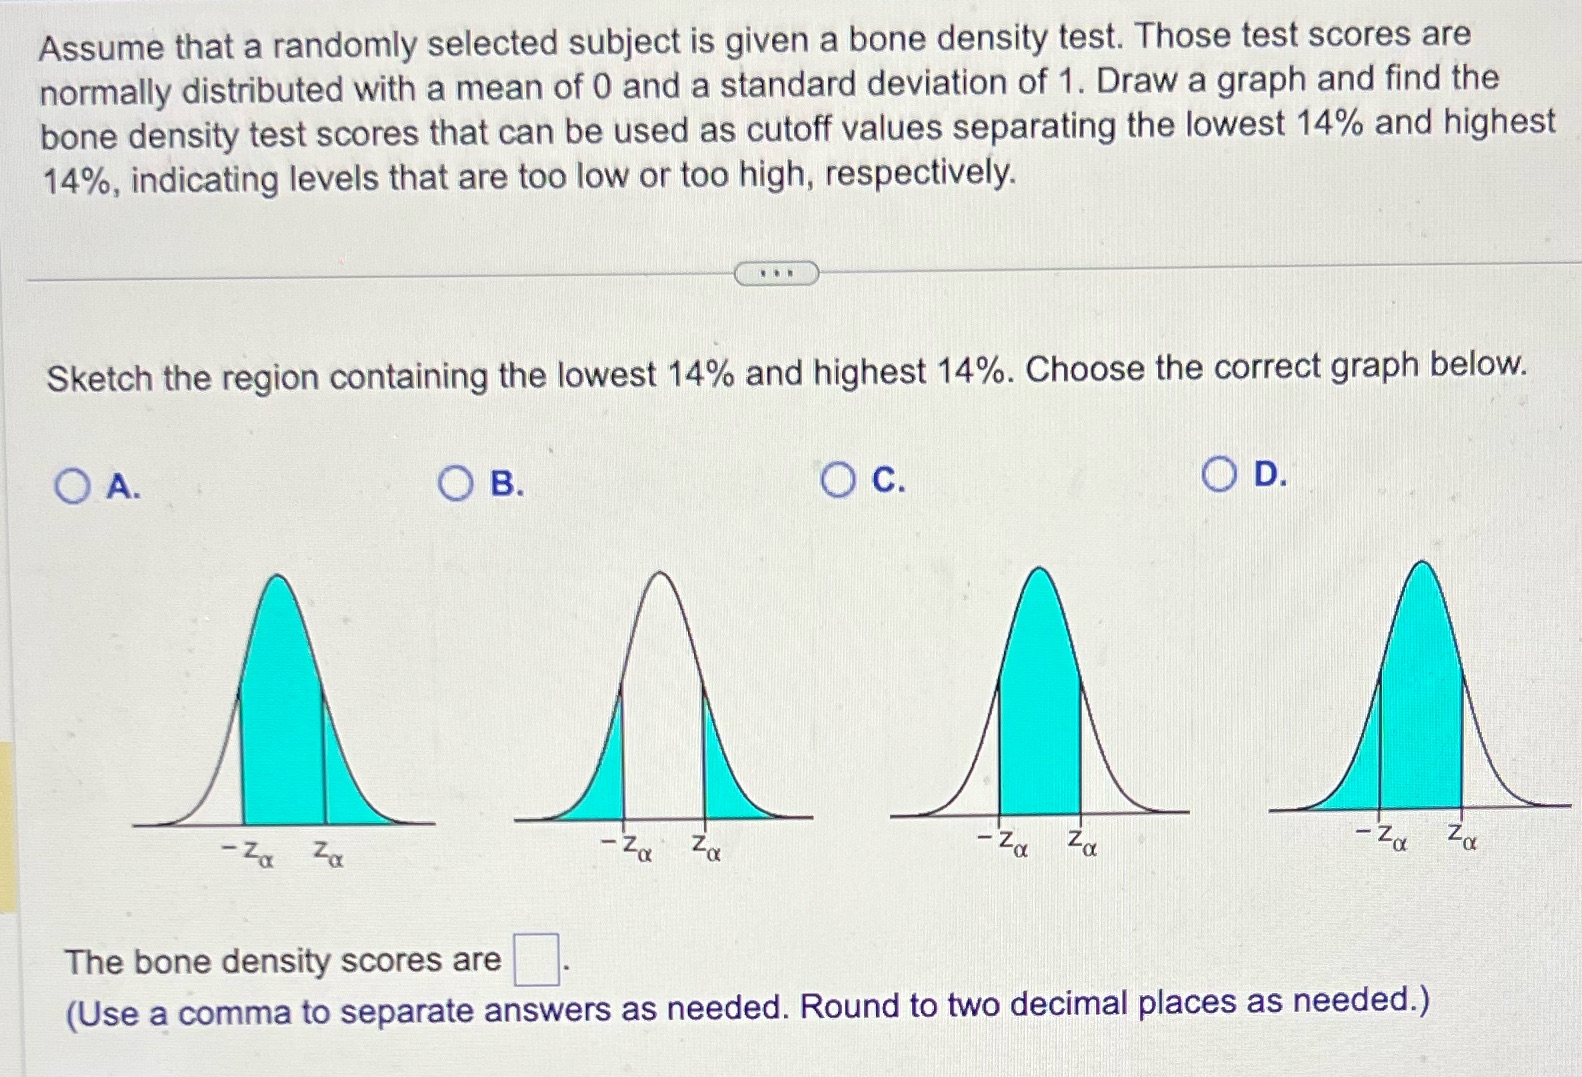
Assume that a randomly selected subject is given a bone density test. Those test scores are normally distributed with a mean of 0 and a standard deviation of 1. Draw a graph and find the bone density test scores that can be used as cutoff values separating the lowest 14% and highest 14%, indicating levels that are too low or too high, respectively. Sketch the region containing the lowest 14% and highest 14%. Choose the correct graph below. A. -Za Za B. C. D. -Z Za - Za Z -Za Za The bone density scores are (Use a comma to separate answers as needed. Round to two decimal places as needed.)
Step by Step Solution
There are 3 Steps involved in it

Get step-by-step solutions from verified subject matter experts