

Question: Assume that a randomly selected subject is given a bone density lest. Eione density test scores are normally distributed with a mean off] and a
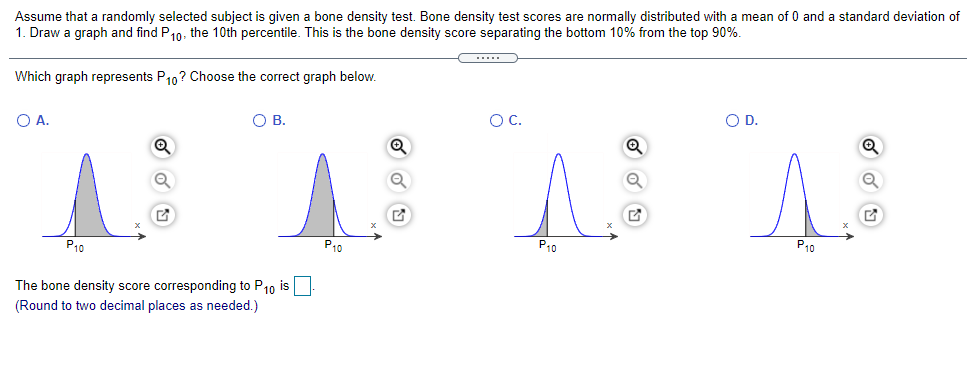
Assume that a randomly selected subject is given a bone density lest. Eione density test scores are normally distributed with a mean off] and a standard deviation of 1. Draw a graph and nd P10, the 'llth percentile. This is the bone density score separating the bottom 10% from the top 90%. \"- Which graph represents P10? Choose the correct graph below. 0 A. O B. O c. O o. {Q -.Q -:Q:- Q Q Q Q 5:3,":- -:'rf'.':- fir:- 5:3,":- x . _ . x . _ . x . _ . x . _ . F10 P10 P10 P10 The bone density score corresponding to P10 is (Round to two decimal places as needed.)
Step by Step Solution
There are 3 Steps involved in it
1 Expert Approved Answer
Step: 1 Unlock

Question Has Been Solved by an Expert!
Get step-by-step solutions from verified subject matter experts
Step: 2 Unlock
Step: 3 Unlock