

Question: Assume that the provided data in exhibit 4 is for 2013 to 2022. Which indicator in exhibit 4 is better for predicting the net profit?
Assume that the provided data in exhibit 4 is for 2013 to 2022. Which indicator in exhibit 4 is better for predicting the net profit? Why? Then show how you will predict profit for 2023 based on the best factor.
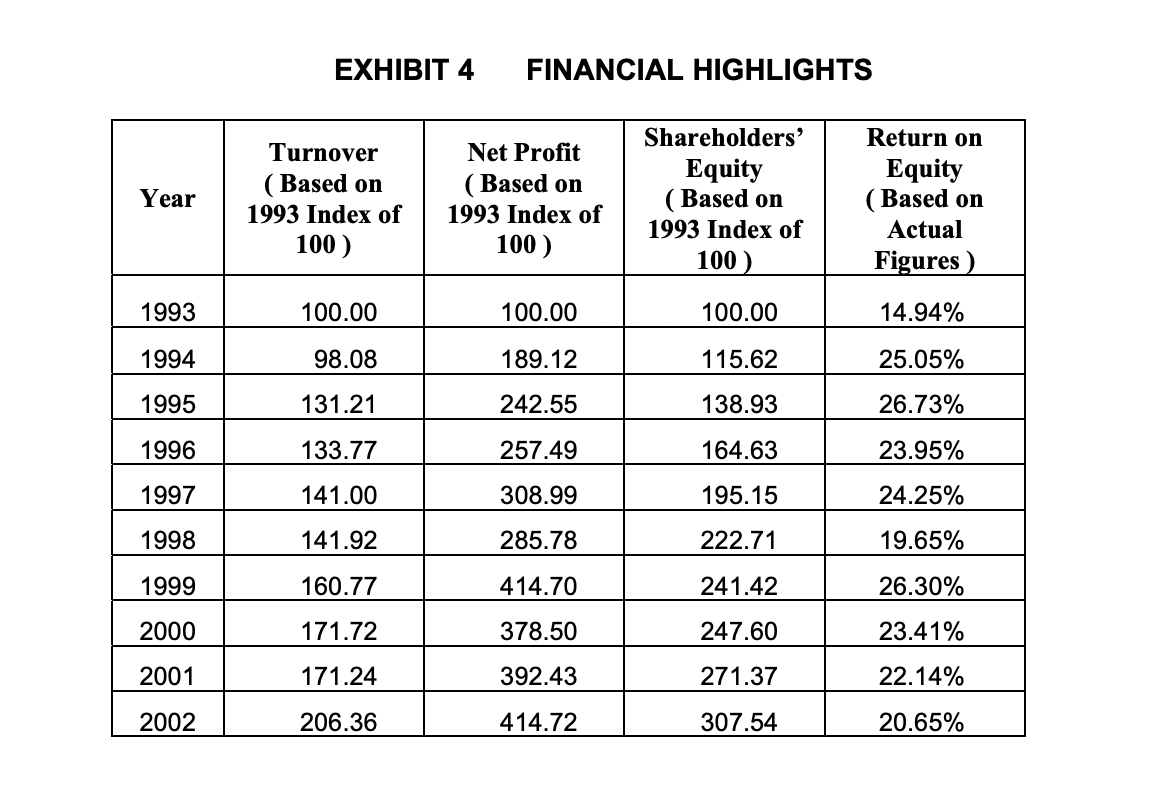
EXHIBIT 4 FINANCIAL HIGHLIGHTS Turnover Net Profit Shareholders' Return on Year ( Based on ( Based on Equity Equity 1993 Index of 1993 Index of ( Based on ( Based on 100) 1993 Index of 100 ) Actual 100 ) Figures ) 1993 100.00 100.00 100.00 14.94% 1994 98.08 189.12 115.62 25.05% 1995 131.21 242.55 138.93 26.73% 1996 133.77 257.49 164.63 23.95% 1997 141.00 308.99 195.15 24.25% 1998 141.92 285.78 222.71 19.65% 1999 160.77 414.70 241.42 26.30% 2000 171.72 378.50 247.60 23.41% 2001 171.24 392.43 271.37 22.14% 2002 206.36 414.72 307.54 20.65%
Step by Step Solution
There are 3 Steps involved in it

Get step-by-step solutions from verified subject matter experts