Question: assume the data is correct in table 4, how would you calculate the problems a,b,c below. please show step by step i need to understand.

assume the data is correct in table 4, how would you calculate the problems a,b,c below. please show step by step i need to understand. thanks assume the data is correct in table 4, how would
Exercise C: Determining protein concentration and percent protein Table 3. Albumin standard curve - used for creating protein concentration curve Concentration 0% 0.5% 1% 2% Absorbance 13 13 12. 3% 4% Table 4. Quantifications of protein sample to determine concentration cannot low l Absorbance of protein sample urve rade Stoela through exula Concentration of protein sample (%, g/100ml) - based on standard curve values Volume of protein extract (ml) - supernatant volume after centrifugation Org Mass of protein (g, multiply concentration of protein and volume of protein extract) Mass of lima bean sample weighed out (g) 20.39 Percent protein in a lima bean sample (%) Determine the percent protein of your bean sample by doing the following: A) Using the absorbance of your protein sample, determine the concentration of your protein sample using your standard curve from Table 3. Show your work below! B) Determine the mass of protein you collected by taking the concentration of protein sample (g/100ml) and multiply by your volume of protein extract (ml). This should cancel out the "ml" units to yield you "gof protein. Show your work below! c) Compare the total protein mass you collected from the lima bean to the mass of the lima bean itself by dividing the two numbers (mass collected / total lima bean mass initially) and multiply by 100 to get the percent protein What was your percent protein from the lima bean? How does this compare to the known protein content to vegetables or meats? Exercise C: Determining protein concentration and percent protein Table 3. Albumin standard curve - used for creating protein concentration curve Concentration 0% 0.5% 1% 2% Absorbance 13 13 12. 3% 4% Table 4. Quantifications of protein sample to determine concentration cannot low l Absorbance of protein sample urve rade Stoela through exula Concentration of protein sample (%, g/100ml) - based on standard curve values Volume of protein extract (ml) - supernatant volume after centrifugation Org Mass of protein (g, multiply concentration of protein and volume of protein extract) Mass of lima bean sample weighed out (g) 20.39 Percent protein in a lima bean sample (%) Determine the percent protein of your bean sample by doing the following: A) Using the absorbance of your protein sample, determine the concentration of your protein sample using your standard curve from Table 3. Show your work below! B) Determine the mass of protein you collected by taking the concentration of protein sample (g/100ml) and multiply by your volume of protein extract (ml). This should cancel out the "ml" units to yield you "gof protein. Show your work below! c) Compare the total protein mass you collected from the lima bean to the mass of the lima bean itself by dividing the two numbers (mass collected / total lima bean mass initially) and multiply by 100 to get the percent protein What was your percent protein from the lima bean? How does this compare to the known protein content to vegetables or meats

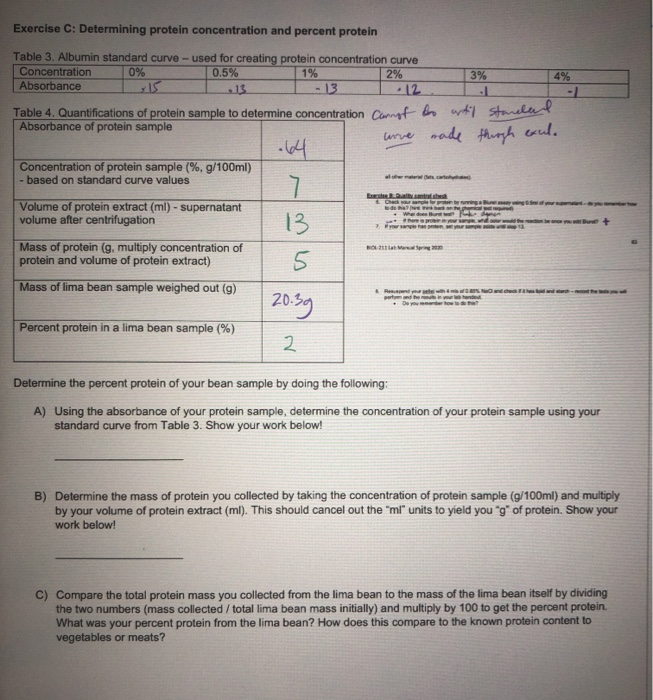
Step by Step Solution

There are 3 Steps involved in it

1 Expert Approved Answer
Step: 1 Unlock blur-text-image
Question Has Been Solved by an Expert!

Get step-by-step solutions from verified subject matter experts

Step: 2 Unlock
Step: 3 Unlock

Students Have Also Explored These Related General Management Questions!