

Question: Assuming that acetaminophen does not affect social pain at all (i.e., assuming the null hypothesis is true), create a distribution of sample mean differences based
Assuming that acetaminophen does not affect social pain at all (i.e., assuming the null hypothesis is true), create a distribution of samplemean differencesbased on the two sample sizes ofndrug= 31 andncontrol= 31. This distribution represents the frequency of all possible samplemean differenceswhen both sample sizes are 31. You should label the frequency histogram so that it is centered on the samplemean differenceyou expect if the null is true. Look back at your answer to Question 6 to determine what the mean of the distribution of sample means should be if the null hypothesis is true.
- After you label the mean, label each standard error of the mean to the right and left of the mean. You computed the standard error of the mean in Question 8.
- Next, use the independenttformula to determine thetscore associated with each sample mean difference. In other words, convert each raw mean difference score on the distribution into atvalue.
- Finally, label the criticaltvalue and shade the critical region. You will need to consult a criticaltvalue table to locate the critical value oft.
Fill in the graph below with the information required above.Report all values to the hundredth place.
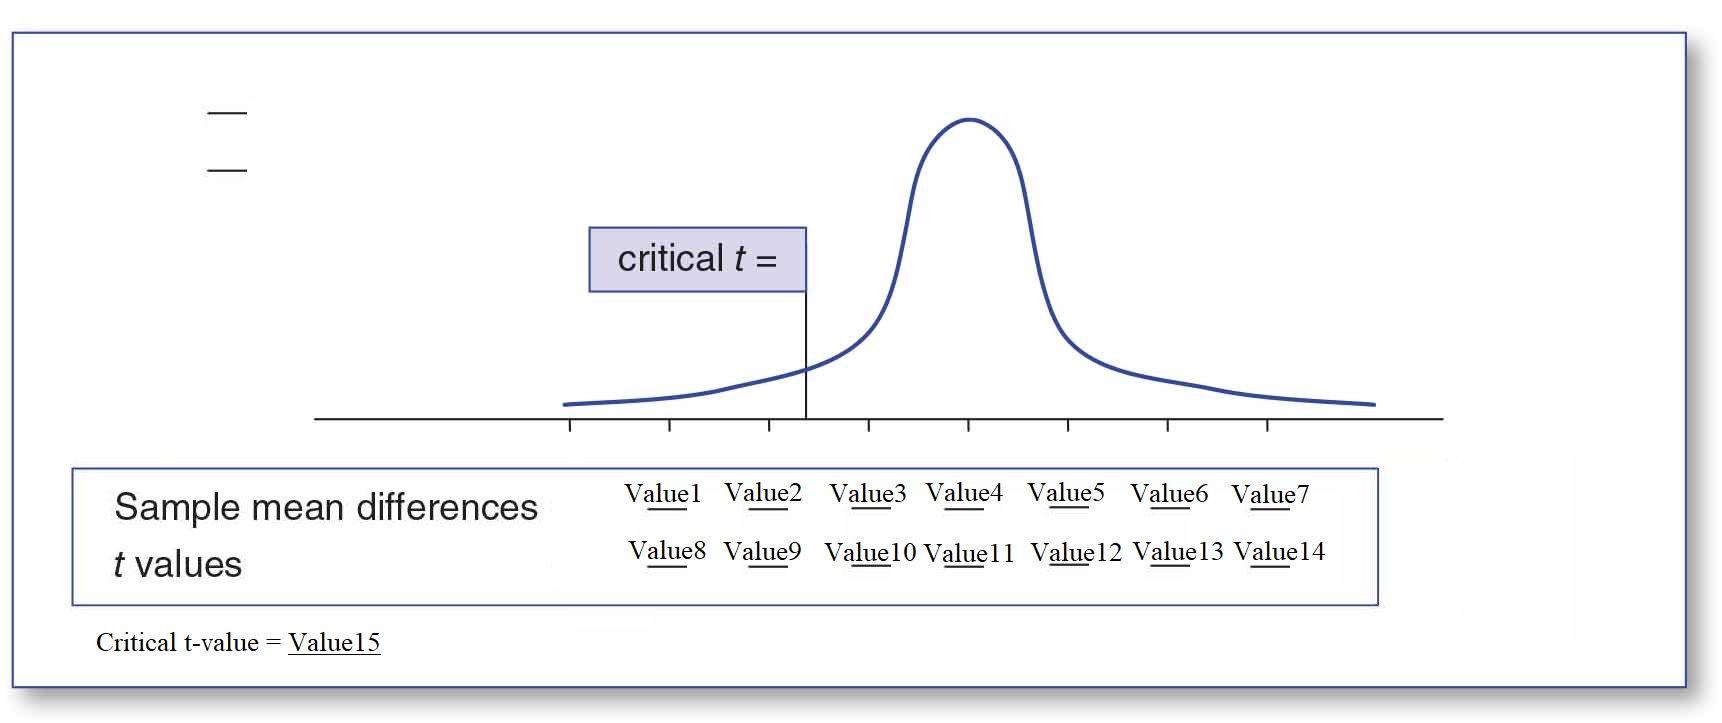
critical t = Sample mean differences Valuel Value2 Value3 Value4 Value5 Value6 Value7 t values Value8 Value9 Value10 Valuell Value12 Value13 Value14 Critical t-value = Value15
Step by Step Solution
There are 3 Steps involved in it

Get step-by-step solutions from verified subject matter experts