

Question: assuming that the process standard deviation is 0.3, what are the three sigma upper and lower limits control limits for the sample range chart Assuming
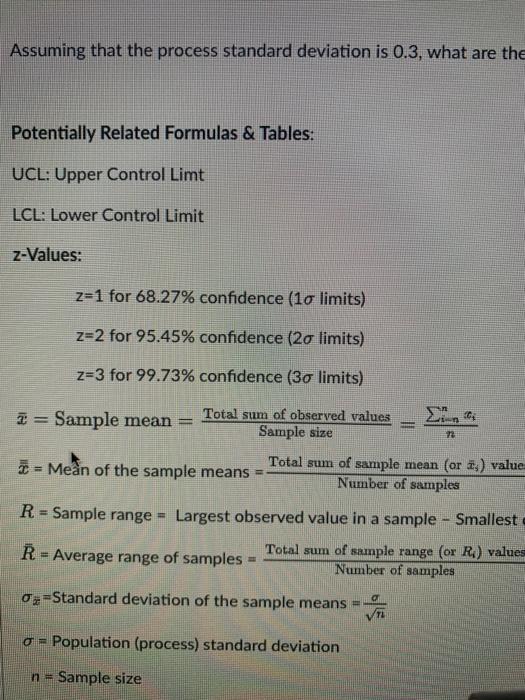
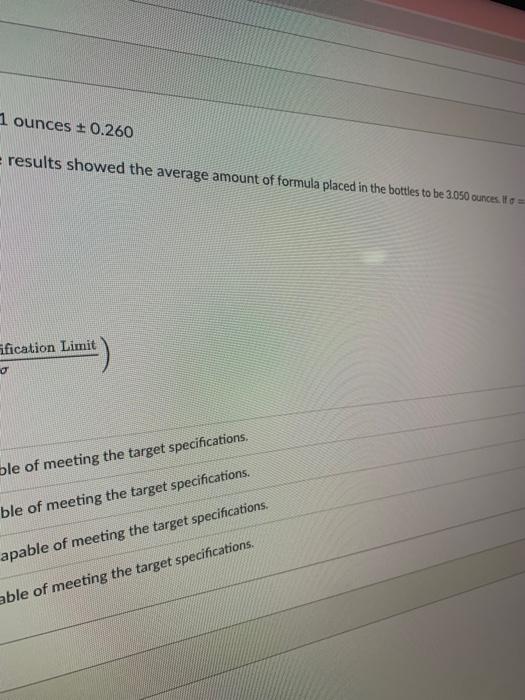
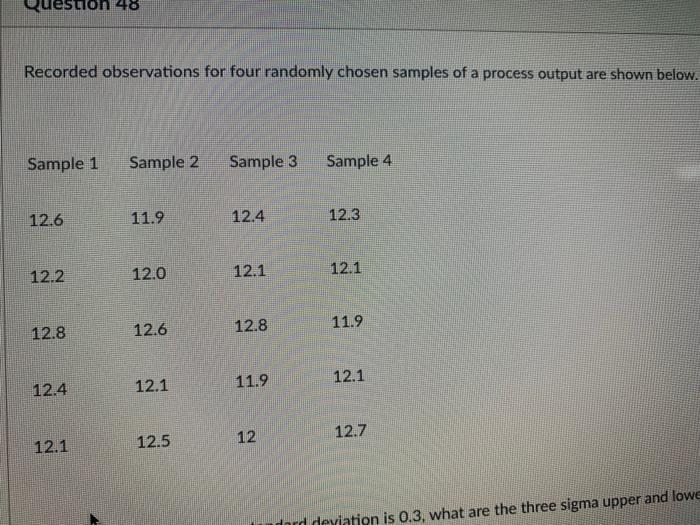
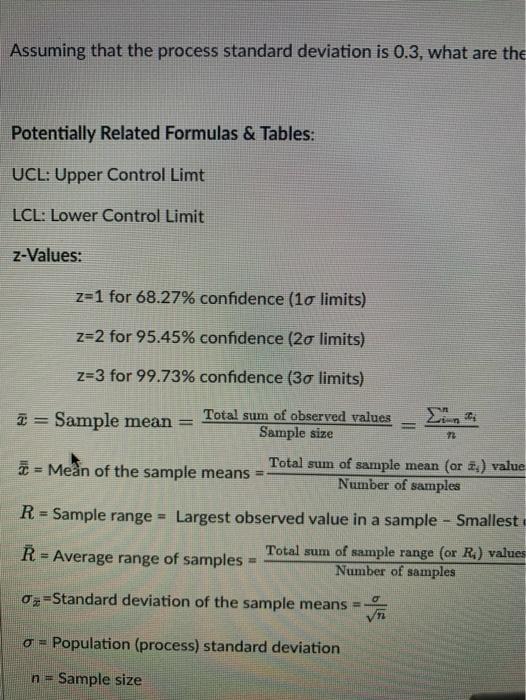
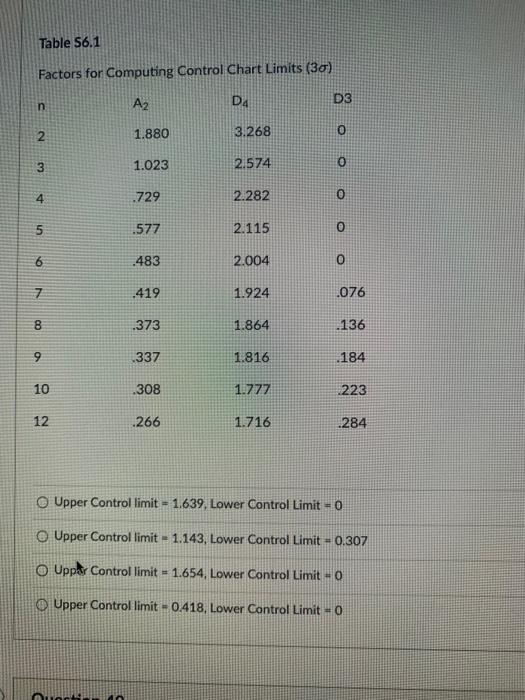
Assuming that the process standard deviation is 0.3, what are the Potentially Related Formulas \& Tables: UCL: Upper Control Limt LCL: Lower Control Limit z-Values: results showed the average amount of formula placed in the bottles to be 3.050 ounces if = ification Limit ) ble of meeting the target specifications. ble of meeting the target specifications. apable of meeting the target specifications. able of meeting the target specifications. Recorded observations for four randomly chosen samples of a process output are shown below. Assuming that the process standard deviation is 0.3 , what are the Potentially Related Formulas \& Tables: UCL: Upper Control Limt LCL: Lower Control Limit z-Values: z=1 for 68.27% confidence ( 1 limits) z=2 for 95.45% confidence (2 limits) z=3 for 99.73% confidence ( 3 limits) x= Sample mean =SamplesizeTotalsumofobservedvalues=ni=nnxi x= Men of the sample means =NumberofsamplesTotalsumofsamplemean(orxi)value R= Sample range = Largest observed value in a sample - Smallest R= Average range of samples =NumberofsamplesTotalsumofsamplerange(orRi)value x= Standard deviation of the sample means =n = Population (process) standard deviation n= Sample size Table 56.1 Factors for Computing Control Chart Limits (3) Upper Control limit =1.639, Lower Control Limit =0 Upper Control limit =1.143, Lower Control Limit =0.307 Uppar Control limit =1.654, Lower Control Limit =0 Upper Control limit =0.418, Lower Control Limit =0
Step by Step Solution
There are 3 Steps involved in it

Get step-by-step solutions from verified subject matter experts