

Question: AT 14400 Performance Charts Worksheet Cessna Charts Airspeed Correction Table (Figure 5-1) 1) Flaps Up IAS - 80 Find: CAS Stall Speeds (Figure 5-3)
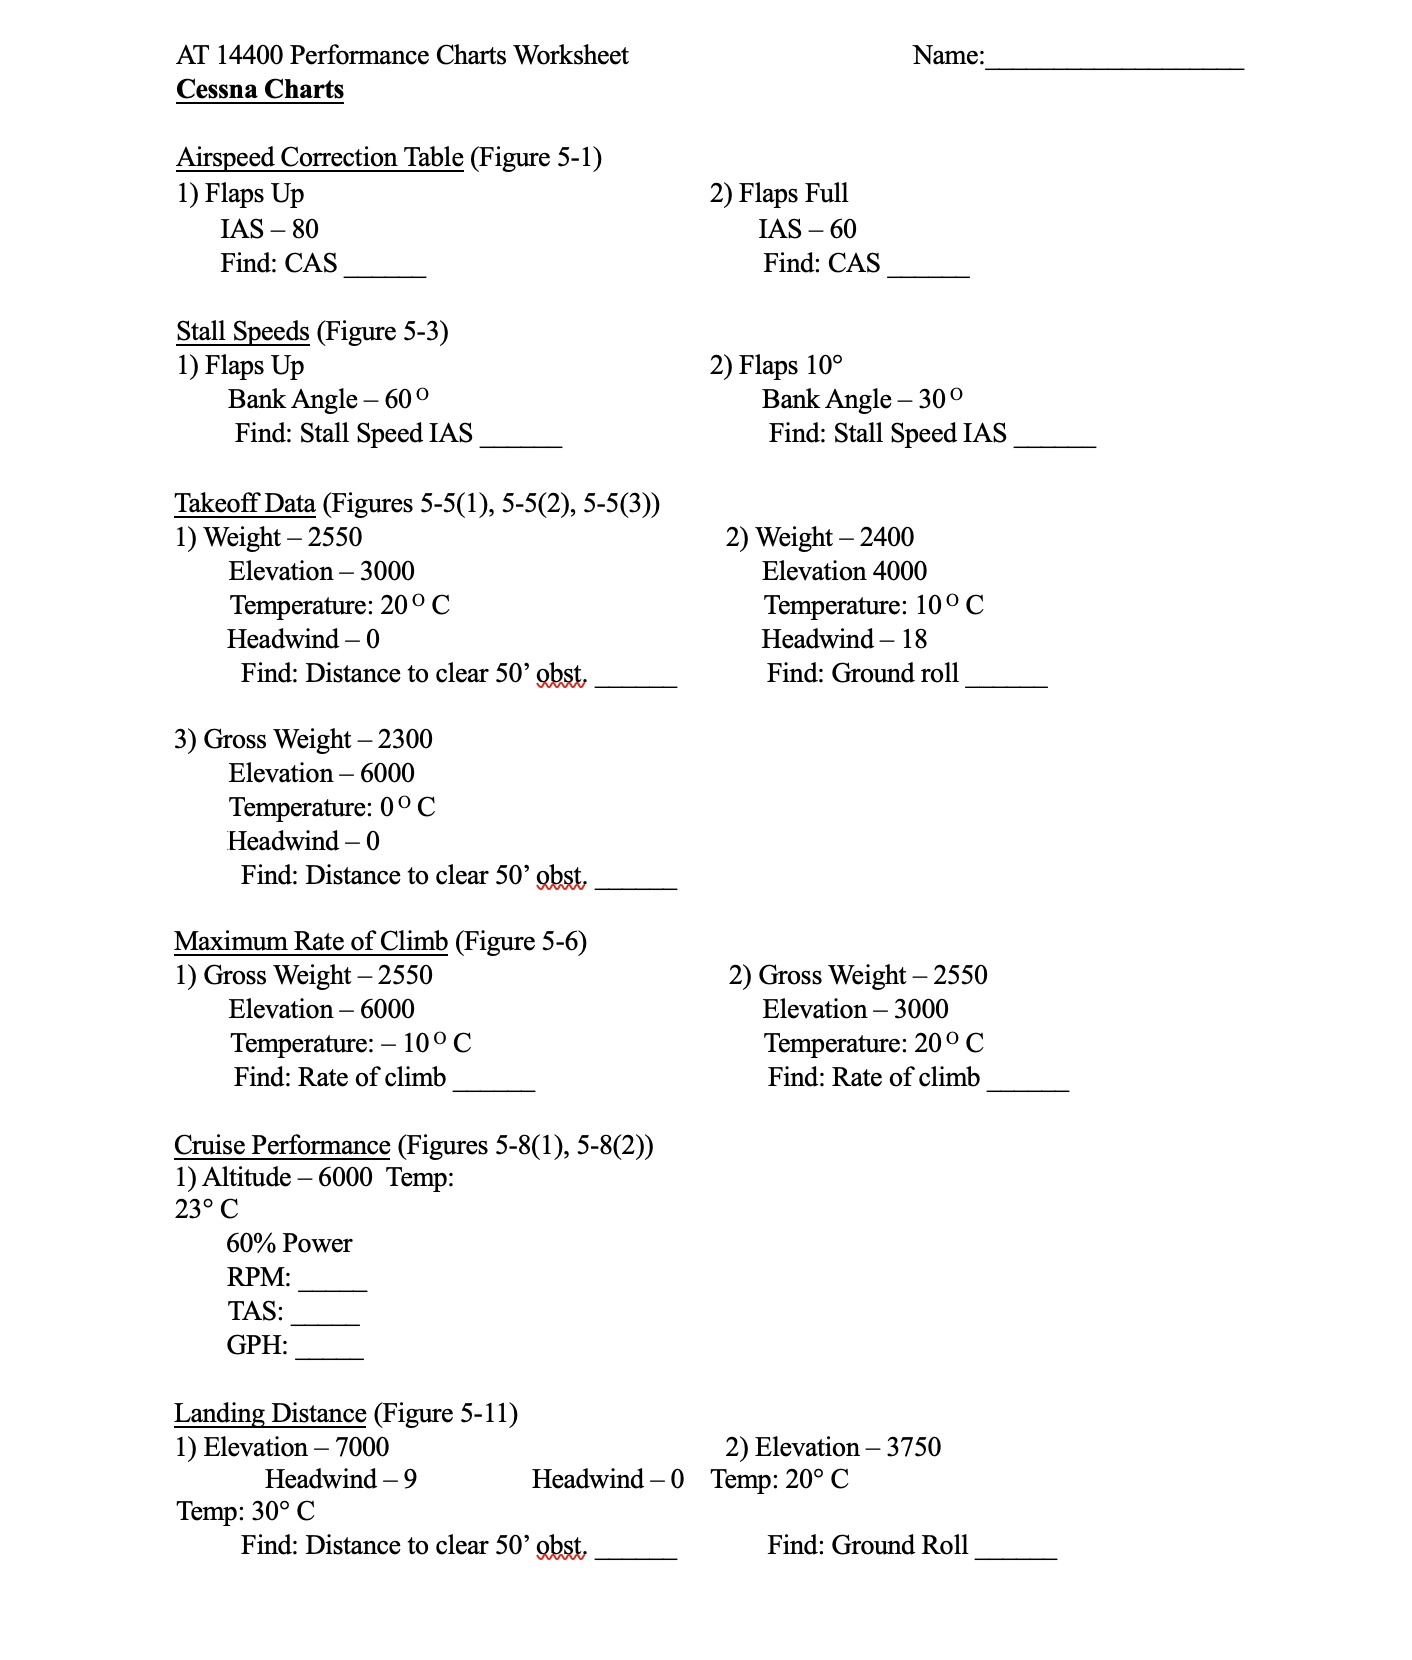
AT 14400 Performance Charts Worksheet Cessna Charts Airspeed Correction Table (Figure 5-1) 1) Flaps Up IAS - 80 Find: CAS Stall Speeds (Figure 5-3) 1) Flaps Up 2) Flaps Full IAS - 60 Find: CAS 2) Flaps 10 Name: Bank Angle - 60 Find: Stall Speed IAS Takeoff Data (Figures 5-5(1), 5-5(2), 5-5(3)) 1) Weight 2550 Elevation 3000 Temperature: 20C Headwind - 0 Find: Distance to clear 50' obst 3) Gross Weight - 2300 Elevation 6000 Temperature: 0C Headwind - 0 Find: Distance to clear 50' obst Maximum Rate of Climb (Figure 5-6) 1) Gross Weight - 2550 Elevation 1 - 6000 Temperature: -10C Find: Rate of climb Cruise Performance (Figures 5-8(1), 5-8(2)) 1) Altitude 6000 Temp: 23 C 60% Power Bank Angle - 30 Find: Stall Speed IAS 2) Weight 2400 Elevation 4000 Temperature: 10C Headwind 18 Find: Ground roll 2) Gross Weight - 2550 Elevation 3000 - Temperature: 20C Find: Rate of climb RPM: TAS: GPH: Landing Distance (Figure 5-11) 1) Elevation 7000 Headwind 9 2) Elevation 3750 Headwind 0 Temp: 20 C Temp: 30 C Find: Distance to clear 50' obst. Find: Ground Roll
Step by Step Solution
There are 3 Steps involved in it

Get step-by-step solutions from verified subject matter experts