

Question: At this point, we have covered both how to create complex expressions and loops.This enables us to calculate almost arbitrarily complex algorithms limited only by
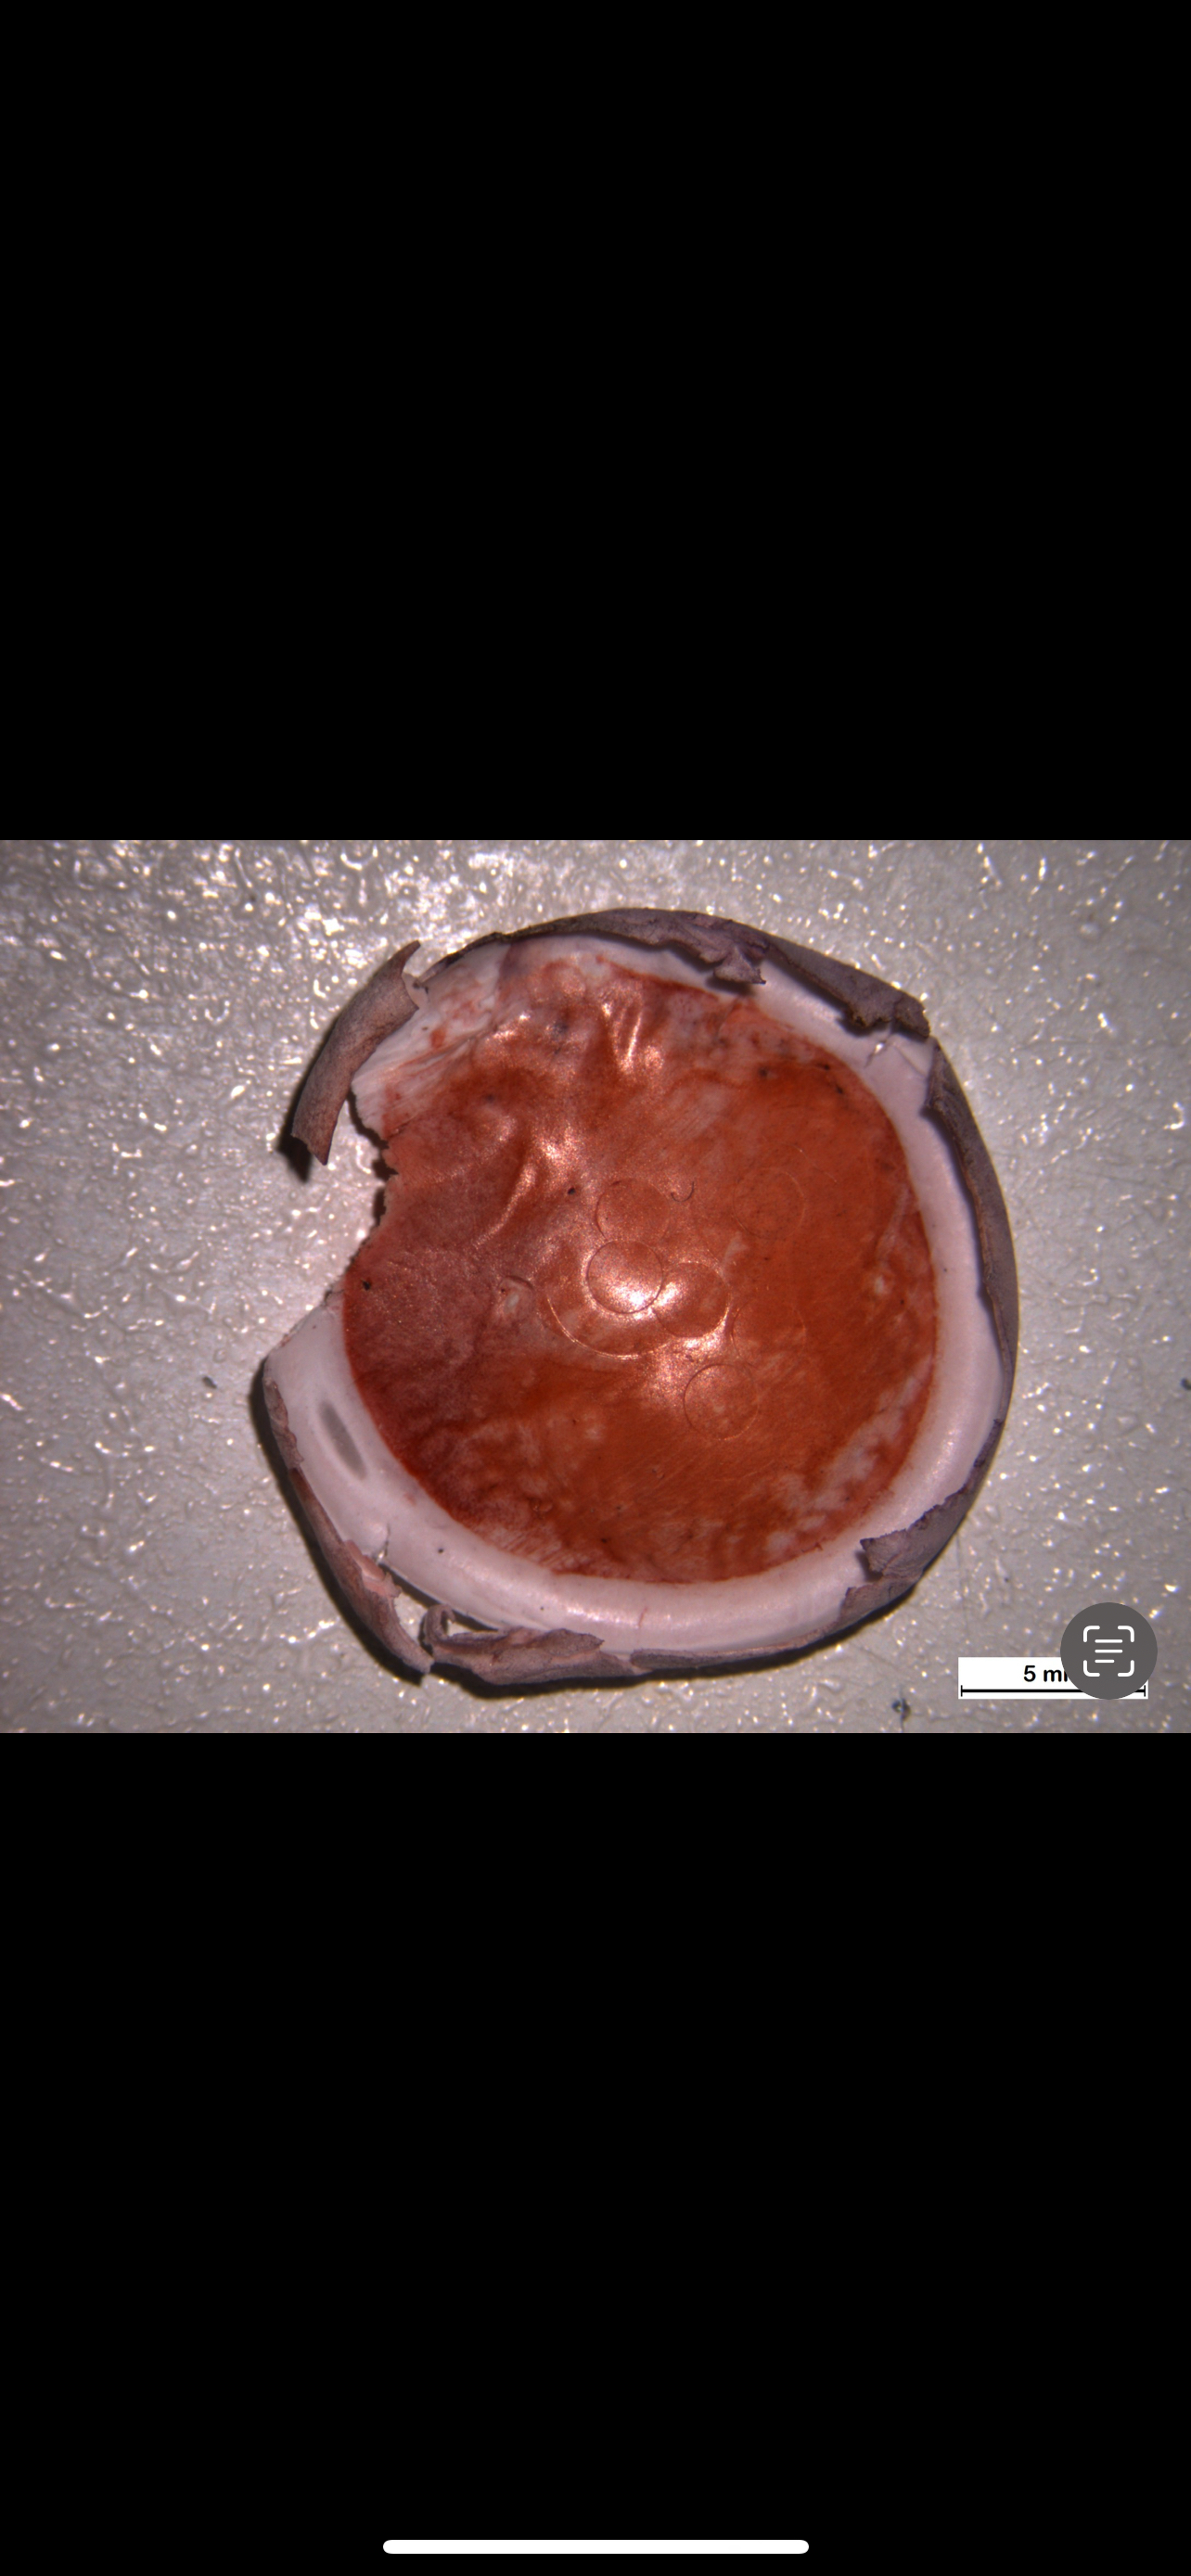
At this point, we have covered both how to create complex expressions and loops.This enables us to calculate almost arbitrarily complex algorithms limited only by your imagination.Additionally, this week we have learned how to create basic GUIs.As a result, you should be able to create a program that is both easy to use and highly functional.Using this new found abilities, I want you to help me to analyze an image based dataset.The other is to analyze color in an area of interest, this requires basic matrix manipulation, but a more complex user interface Project Choice Submit your final working code as an m file a script file and a demonstration explaining what your program accomplishes and some uses for itYour code should include enough comments that it is clear what you are doing.ie x; this sets x to would be totally unnecessary, but something like BW imbinarizeI'adaptive','Sensitivity',; this attempts to threshold the 'light' cells on the 'dark' background using an adaptive method, sensitivity was optimized on the examples image, would be pretty useful.One is a set of pictures of a stain called Alizarin Red. This stain indicates when cells are starting to form bone mineral.In my experiment, I have grown stem cells on different materials. These stem cells are not initially able to form bone mineral, however, they may differentiate in an appropriate environment to cells that can. I would like to see if there is a difference between how the materials mature these stem cells into osteoblasts by detecting whether there is a change in color.On these once white polymer membranes you can see the results:jpg jpgTo succeed you must allow a user to work their way through a set of images, and at the end output the average 'redness' and related statistics in the two experimental groups.Designate the study First, ask whether the user wants to analyze or experimental groupsTo analyze a single file: Ask the user to select a file uigetfile Read the file into matlab imread Ask the user to select an area of interest imcrop Redisplay the image after cropping and ask the user to select an area using an ROI tool. drawcircle Convert the data into a 'redness' value. This is not the value of the red color channel. To figure out why, consider what intensity Red, Green, and Blue are for the color White vs the color Red Compute the mean redness value in the area designated by the ROI createMask Store this data Store this data and continue to the next image. If the user selected groups, you should ask whether that was the last image in group Your final output should include the average and standard deviation of redness for each data set as appropriate as well as a test whether the two groups significantly differ ttest;After your analysis works, create a short writeup analyzing the example files. Don't just say the numbers that you got, explain what they might mean in the context of the experiment.
Step by Step Solution
There are 3 Steps involved in it
1 Expert Approved Answer
Step: 1 Unlock

Question Has Been Solved by an Expert!
Get step-by-step solutions from verified subject matter experts
Step: 2 Unlock
Step: 3 Unlock