

a)Today's economic environment is challenged with higher than normal inflation, and the Bank of Canada has resorted
Fantastic news! We've Found the answer you've been seeking!
Question:
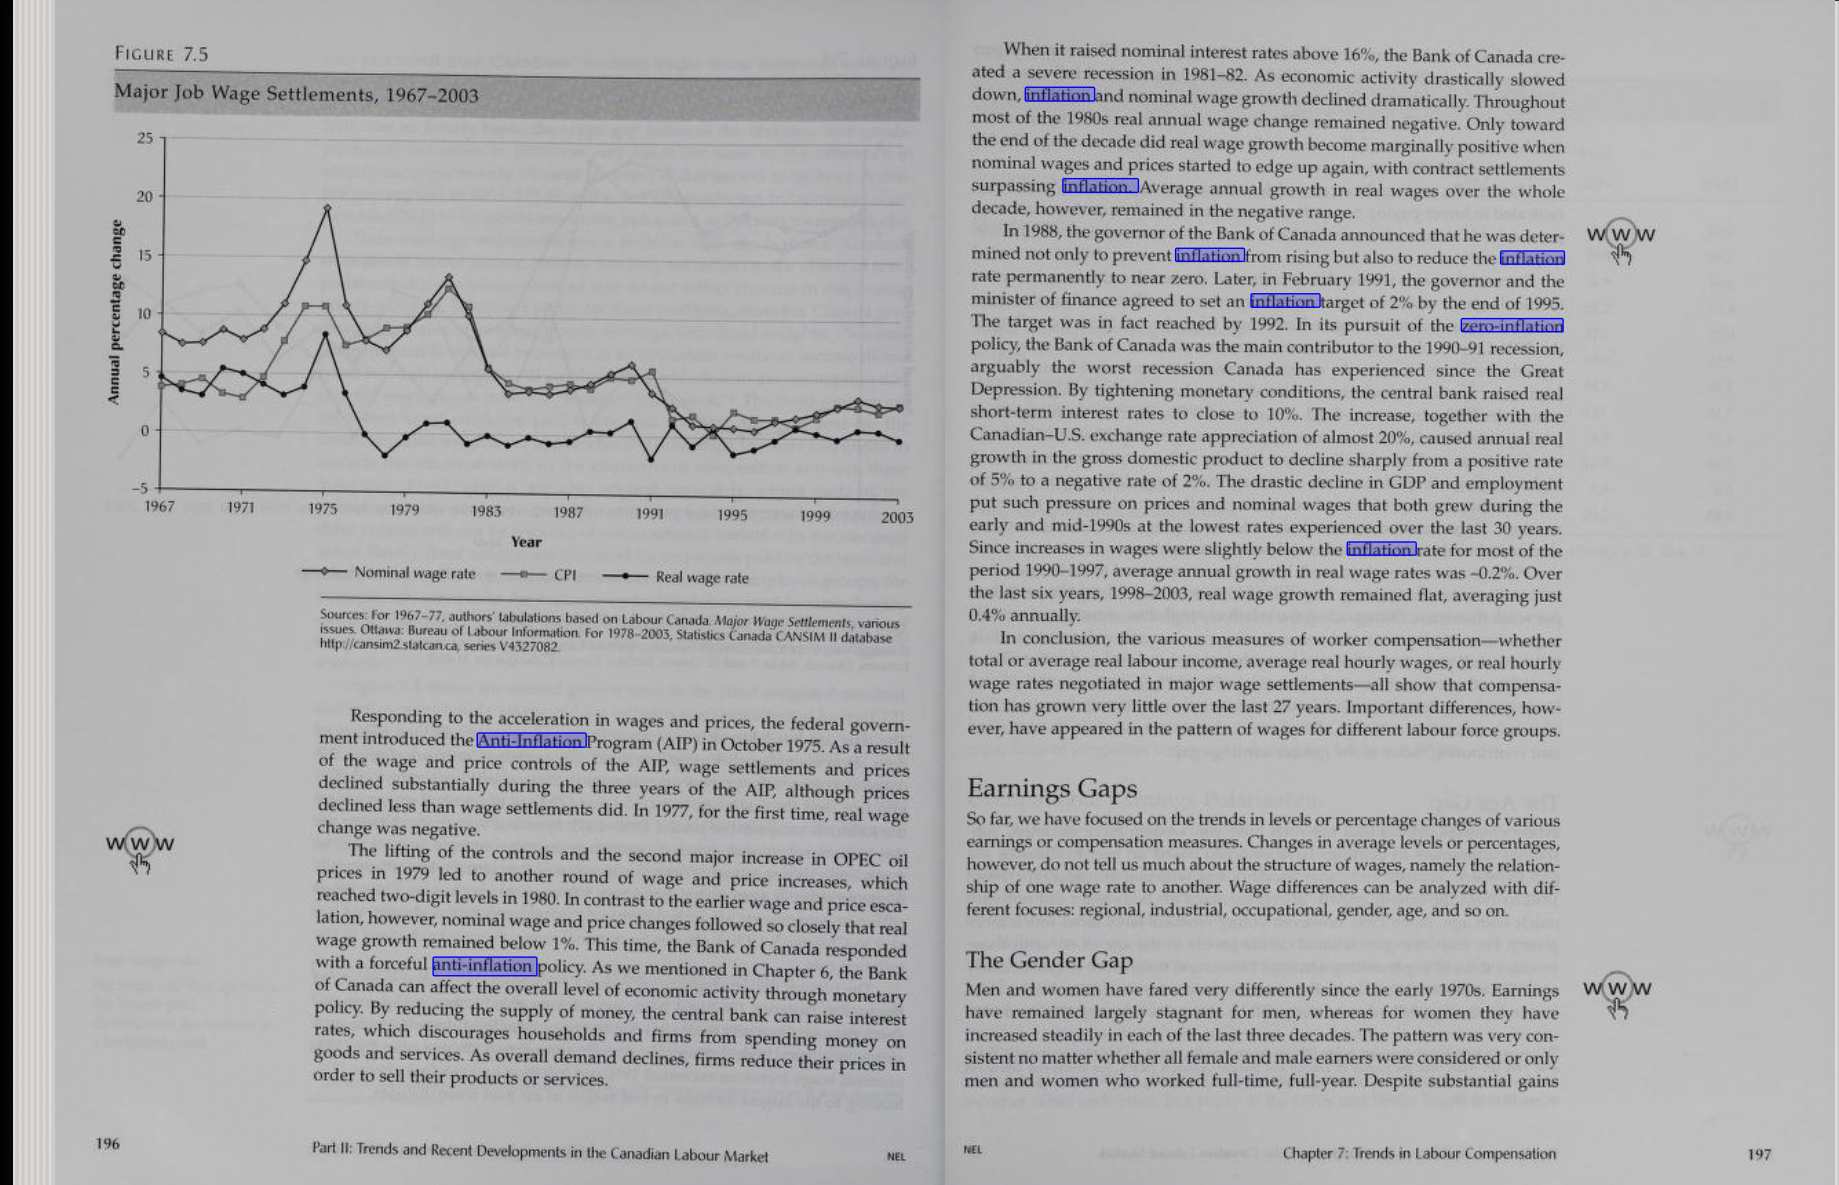
a)Today's economic environment is challenged with higher than normal inflation, and the Bank of Canada has resorted to increasing interest rates to cool the economy. briefly describe the impact on the Canadian labour market when the government and the Bank of Canada tried to reduce and eliminate high inflation in the 1970's.

Expert Answer:
In the 1970s Canada grappled with a surge in inflation prompting concerted efforts by the government ... View the full answer

Related Book For 
Macroeconomics Canada in the Global Environment
ISBN: 978-0321778109
8th edition
Authors: Michael Parkin, Robin Bade
Posted Date:
