

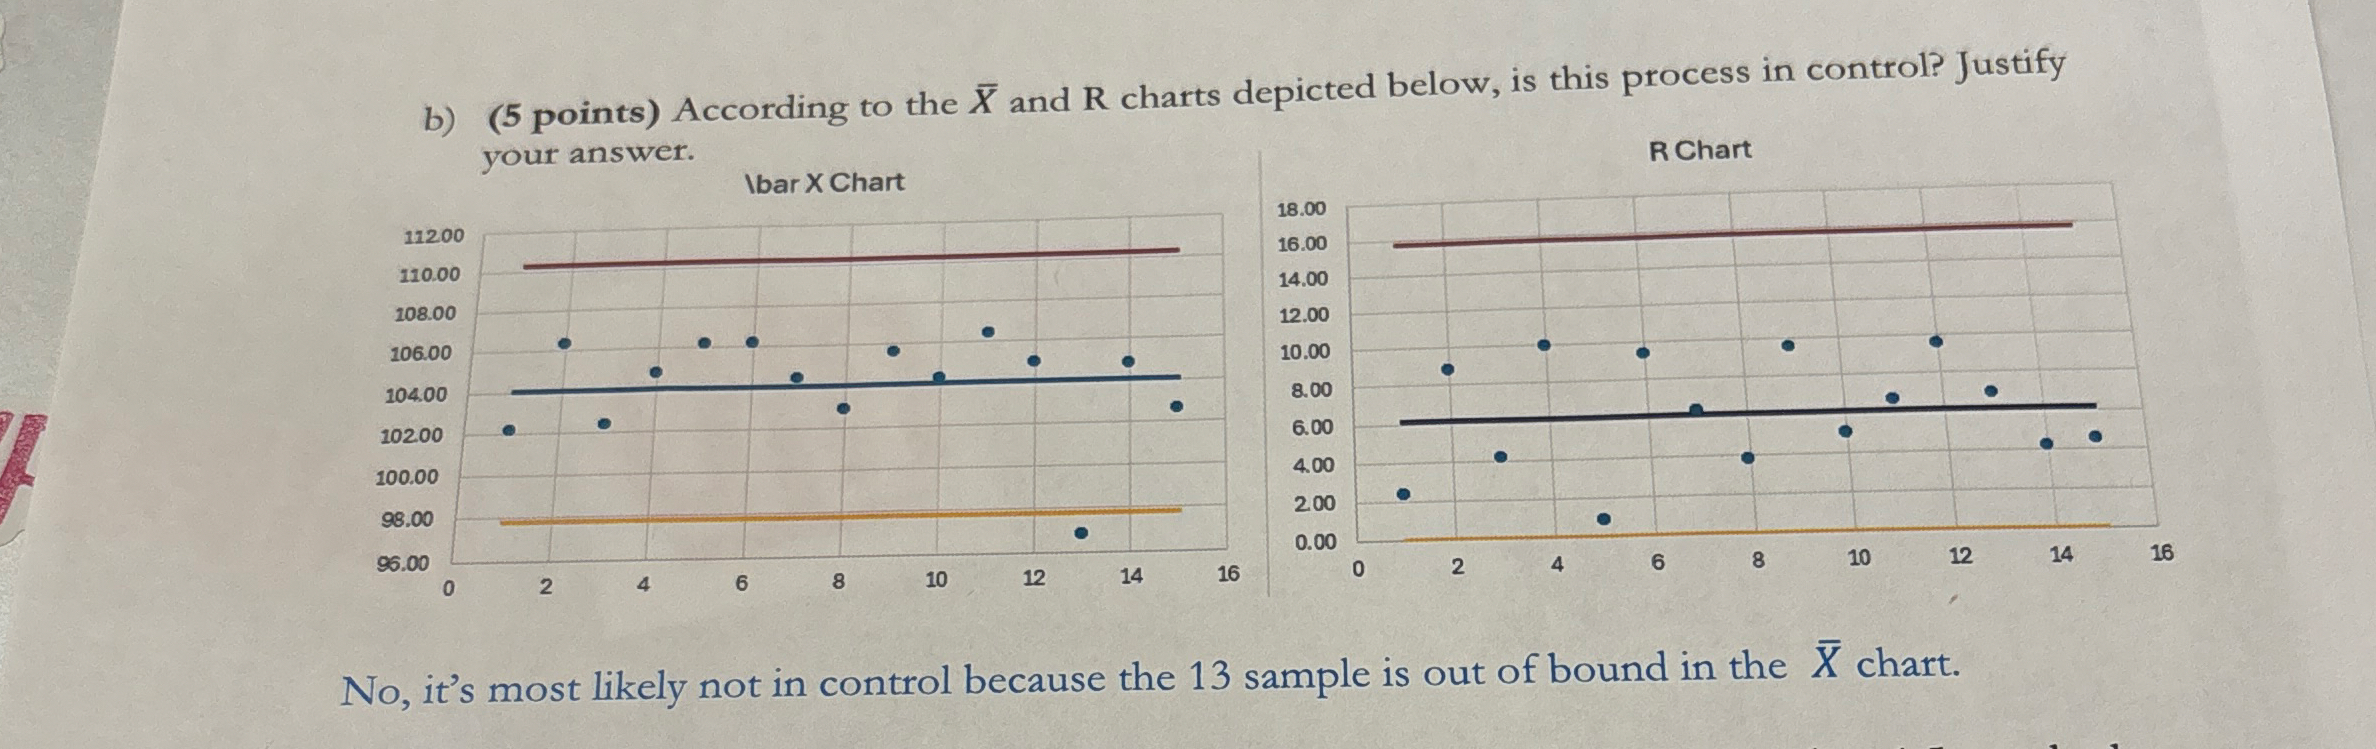
Question: b ) ( 5 points ) According to the x and R charts depicted below, is this process in control? Justify your answer. R Chart
b points According to the and R charts depicted below, is this process in control? Justify your answer.
R Chart
No it's most likely not in control because the sample is out of bound in the chart.
Step by Step Solution
There are 3 Steps involved in it
1 Expert Approved Answer
Step: 1 Unlock

Question Has Been Solved by an Expert!
Get step-by-step solutions from verified subject matter experts
Step: 2 Unlock
Step: 3 Unlock