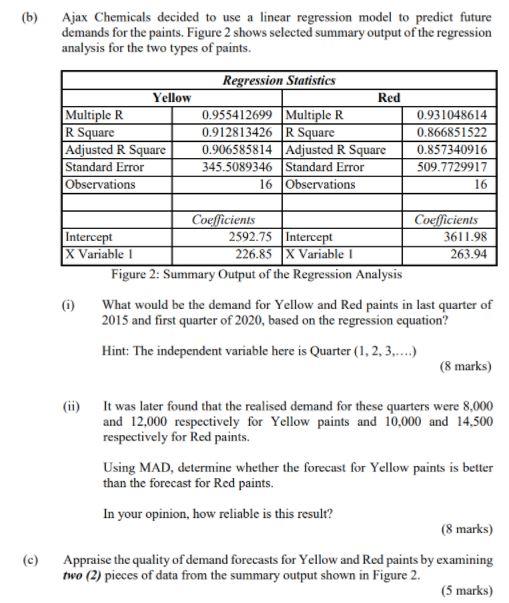
Question: (b) Ajax Chemicals decided to use a linear regression model to predict future demands for the paints. Figure 2 shows selected summary output of the

(b) Ajax Chemicals decided to use a linear

(b) Ajax Chemicals decided to use a linear regression model to predict future demands for the paints. Figure 2 shows selected summary output of the regression analysis for the two types of paints. Yellow Multiple R R Square Adjusted R Square Standard Error Observations Regression Statistics Red 0.955412699 Multiple R 0.912813426 R Square 0.906585814 Adjusted R Square 345.5089346 Standard Error 16 Observations 0.931048614 0.866851522 0.857340916 509.7729917 16 3611.98 Coefficients Coefficients Intercept 2592.75 Intercept X Variable ! 226.85 X Variable ! 263.94 Figure 2: Summary Output of the Regression Analysis (0) What would be the demand for Yellow and Red paints in last quarter of 2015 and first quarter of 2020, based on the regression equation? Hint: The independent variable here is Quarter (1, 2, 3.....) (8 marks) It was later found that the realised demand for these quarters were 8,000 and 12.000 respectively for Yellow paints and 10,000 and 14,500 respectively for Red paints. Using MAD, determine whether the forecast for Yellow paints is better than the forecast for Red paints. In your opinion, how reliable is this result? (8 marks) Appraise the quality of demand forecasts for Yellow and Red paints by examining two (2) pieces of data from the summary output shown in Figure 2. (5 marks) (c)

Step by Step Solution

There are 3 Steps involved in it

1 Expert Approved Answer
Step: 1 Unlock blur-text-image
Question Has Been Solved by an Expert!

Get step-by-step solutions from verified subject matter experts

Step: 2 Unlock
Step: 3 Unlock

Students Have Also Explored These Related General Management Questions!