

Question: b) (BONUS 10 pts) Plot Response Surface Methodology (RSM) surface contours at one of the three specified pH levels in the separate figures. Also plot
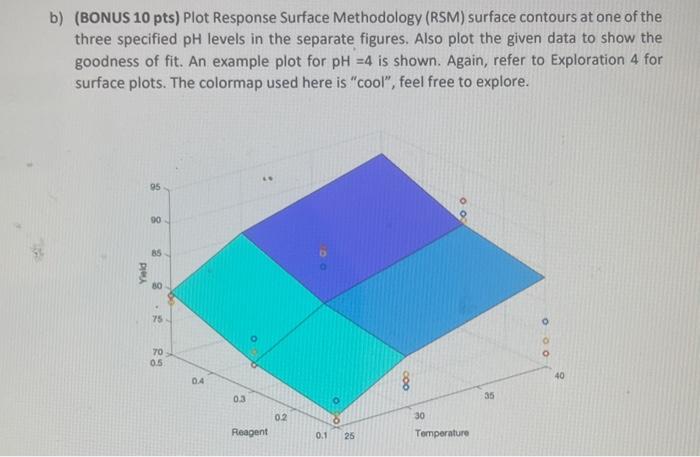
b) (BONUS 10 pts) Plot Response Surface Methodology (RSM) surface contours at one of the three specified pH levels in the separate figures. Also plot the given data to show the goodness of fit. An example plot for pH=4 is shown. Again, refer to Exploration 4 for surface plots. The colormap used here is "cool", feel free to explore. b) (BONUS 10 pts) Plot Response Surface Methodology (RSM) surface contours at one of the three specified pH levels in the separate figures. Also plot the given data to show the goodness of fit. An example plot for pH=4 is shown. Again, refer to Exploration 4 for surface plots. The colormap used here is "cool", feel free to explore
Step by Step Solution
There are 3 Steps involved in it

Get step-by-step solutions from verified subject matter experts