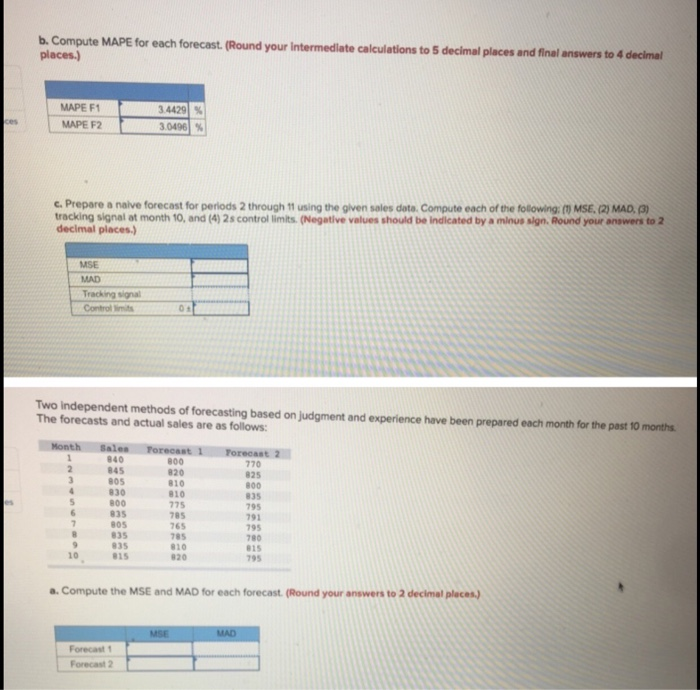
Question: b. Compute MAPE for each forecast. (Round your intermediate calculations to 5 decimal places and final answers to 4 decimal places.) MAPE F1 MAPE F2

b. Compute MAPE for each forecast. (Round your
b. Compute MAPE for each forecast. (Round your intermediate calculations to 5 decimal places and final answers to 4 decimal places.) MAPE F1 MAPE F2 ces 3.4429 3.0496 % c. Prepare a naive forecast for periods 2 through 11 using the given sales dota. Compute each of the following: (1) MSE. (2) MAD, (3) tracking signal at month 10, and (4) 2s control limits. (Negative values should be indicated by a minus sign. Round your answers to 2 decimal places.) MSE MAD Tracking signal Control limits 0 Two independent methods of forecasting based on judgment and experience have been prepared each month for the past 10 months. The forecasts and actual sales are as follows: Month 1 2 5 6 7 8 Sales 840 845 805 830 800 835 BOS 835 835 815 Forecast 1 800 820 810 810 775 785 765 785 810 820 Torecast 2 770 825 800 835 795 791 795 780 815 795 10 a. Compute the MSE and MAD for each forecast (Round your answers to 2 decimal places.) MSE MAD Forecast Forecast 2

Step by Step Solution

There are 3 Steps involved in it

1 Expert Approved Answer
Step: 1 Unlock blur-text-image
Question Has Been Solved by an Expert!

Get step-by-step solutions from verified subject matter experts

Step: 2 Unlock
Step: 3 Unlock

Students Have Also Explored These Related General Management Questions!