

Question: b) Construct the control charts and plot the sample data on the charts. Ten samples of size n=8 have been collected from a process in
b) Construct the control charts and plot the sample data on the charts.
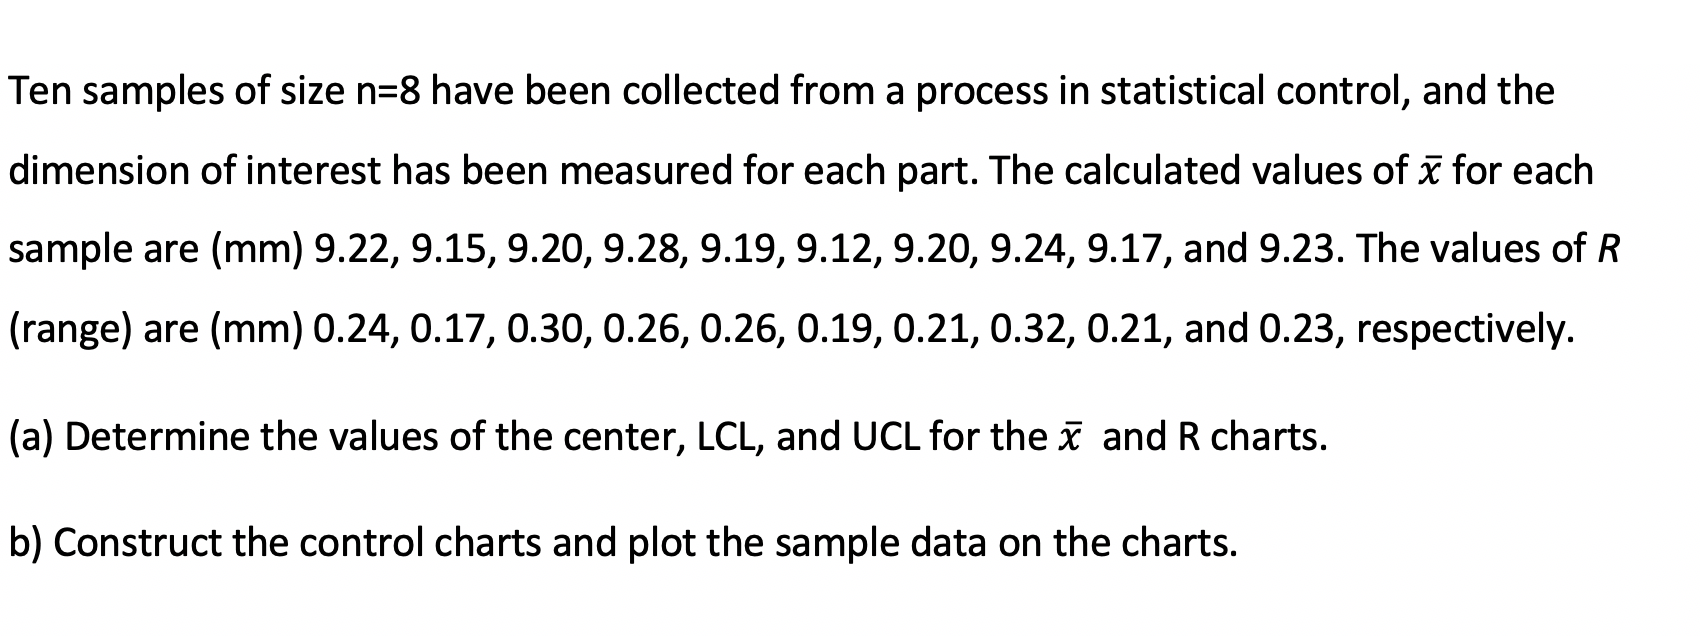
Ten samples of size n=8 have been collected from a process in statistical control, and the dimension of interest has been measured for each part. The calculated values of for each sample are (mm) 9.22, 9.15, 9.20, 9.28, 9.19, 9.12, 9.20, 9.24, 9.17, and 9.23. The values of R (range) are (mm) 0.24, 0.17, 0.30, 0.26, 0.26, 0.19, 0.21, 0.32, 0.21, and 0.23, respectively. (a) Determine the values of the center, LCL, and UCL for the and R charts. b) Construct the control charts and plot the sample data on the chartsStep by Step Solution
There are 3 Steps involved in it
1 Expert Approved Answer
Step: 1 Unlock

Question Has Been Solved by an Expert!
Get step-by-step solutions from verified subject matter experts
Step: 2 Unlock
Step: 3 Unlock