

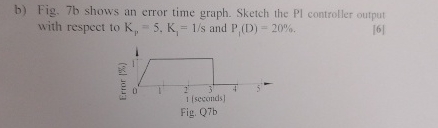
Question: b ) Fig, 7 b shows an error time graph. Sketch the PI controller output with respect to K p = 5 , K 1
b Fig, b shows an error time graph. Sketch the PI controller output with respect to and
Step by Step Solution
There are 3 Steps involved in it
1 Expert Approved Answer
Step: 1 Unlock

Question Has Been Solved by an Expert!
Get step-by-step solutions from verified subject matter experts
Step: 2 Unlock
Step: 3 Unlock