

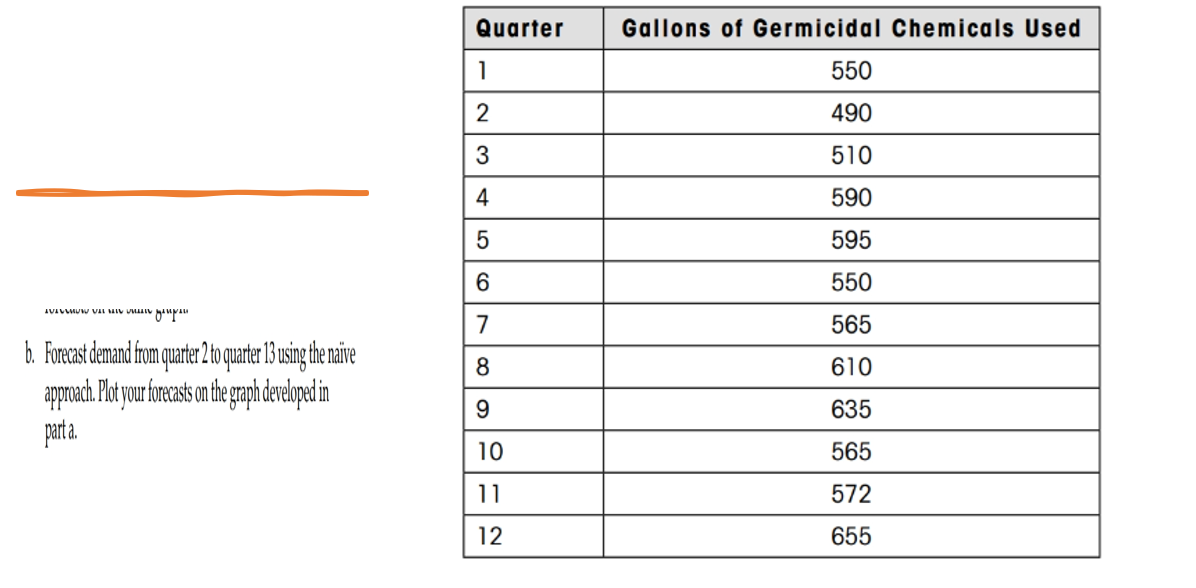
Question: b. Forecast demand from quarter 2 to quarter 13 using the naive approach. Plot your forecasts on the graph developed in parta
b. Forecast demand from quarter 2 to quarter 13 using the naive approach. Plot your forecasts on the graph developed in parta
Step by Step Solution
There are 3 Steps involved in it
1 Expert Approved Answer
Step: 1 Unlock

Question Has Been Solved by an Expert!
Get step-by-step solutions from verified subject matter experts
Step: 2 Unlock
Step: 3 Unlock