

Question: b) The article Orthogonal Design for Process Optimization and Its Application to Plasma Etching (Yin GZ, Jillie DW; Solid State Technology; 1987; 30(5):127-132) describes an
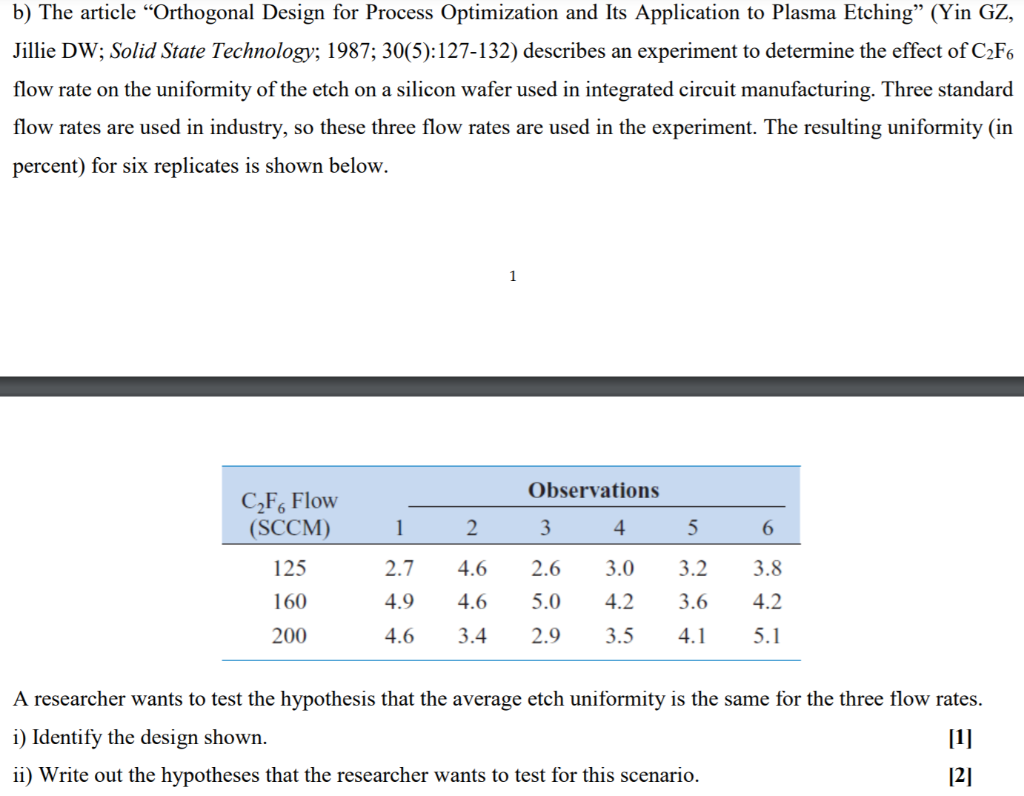
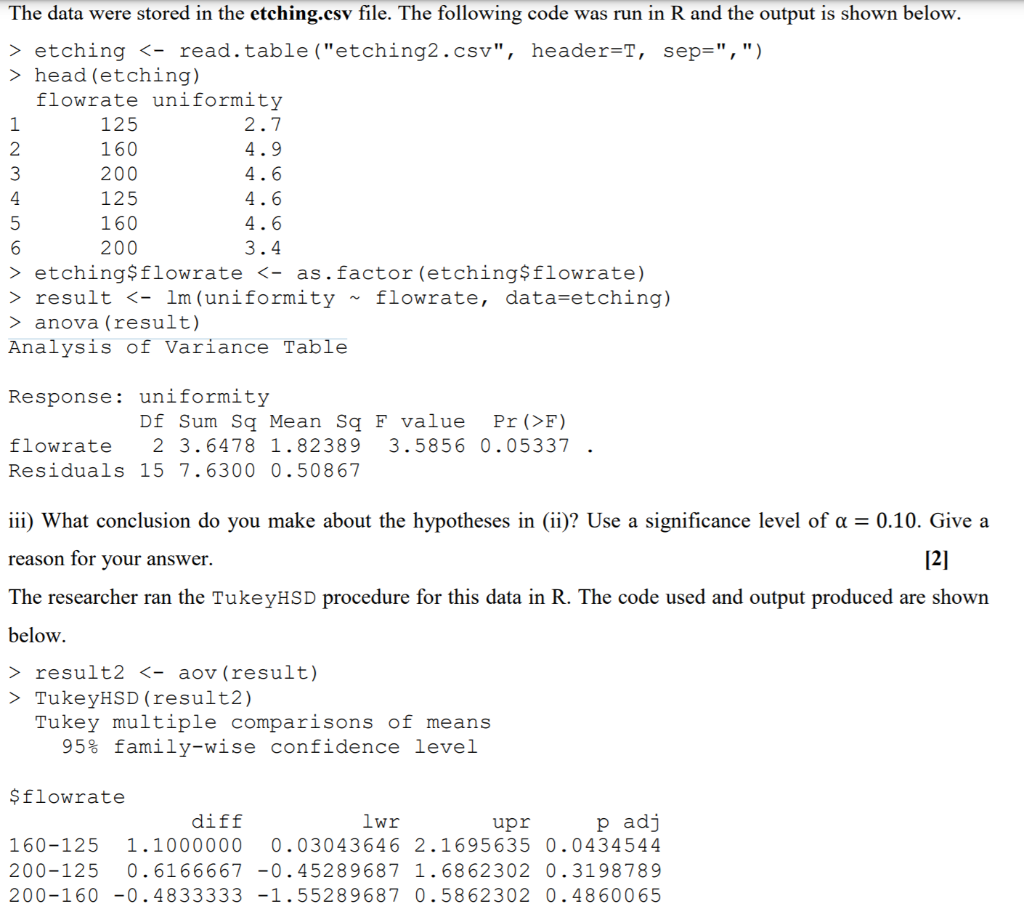
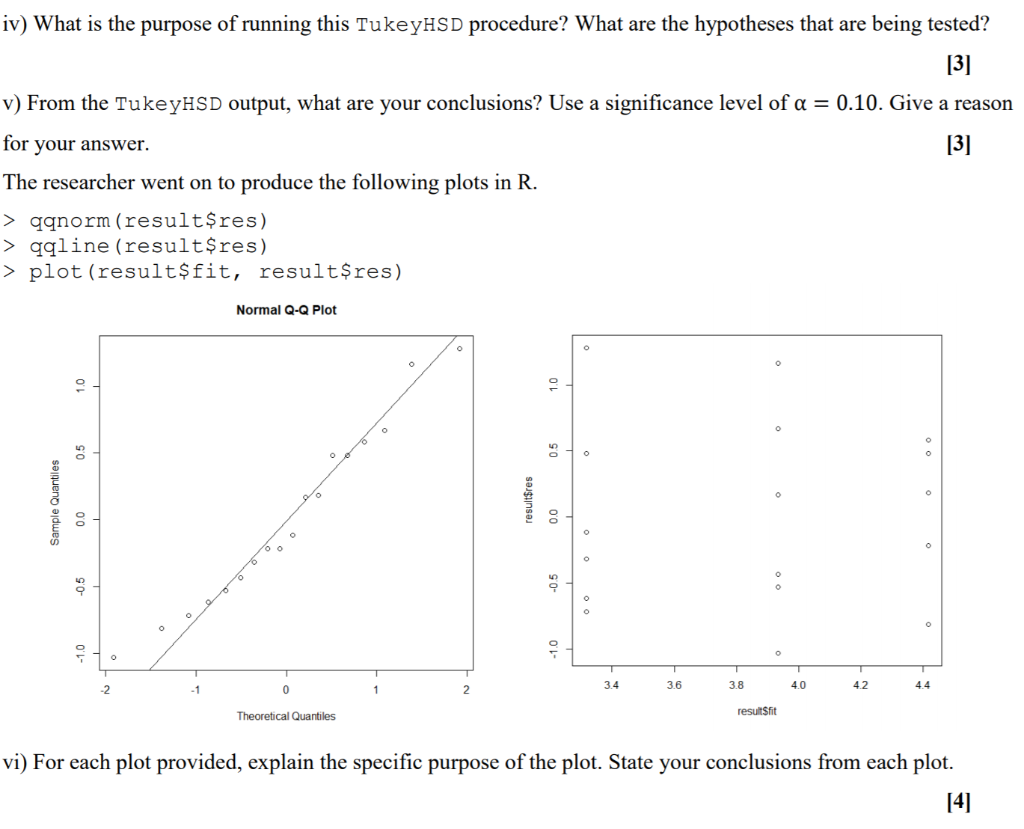
b) The article Orthogonal Design for Process Optimization and Its Application to Plasma Etching (Yin GZ, Jillie DW; Solid State Technology; 1987; 30(5):127-132) describes an experiment to determine the effect of C2F6 flow rate on the uniformity of the etch on a silicon wafer used in integrated circuit manufacturing. Three standard flow rates are used in industry, so these three flow rates are used in the experiment. The resulting uniformity (in percent) for six replicates is shown below. 1 Observations C2F6 Flow (SCCM) 1 2 3 4 5 6 125 2.7 4.6 2.6 3.0 3.2 3.8 160 4.9 4.6 5.0 4.2 3.6 4.2 200 4.6 3.4 2.9 3.5 4.1 5.1 A researcher wants to test the hypothesis that the average etch uniformity is the same for the three flow rates. i) Identify the design shown. [1] ii) Write out the hypotheses that the researcher wants to test for this scenario. [2] The data were stored in the etching.csv file. The following code was run in R and the output is shown below. > etching head (etching) flowrate uniformity 1 125 2.7 2 160 4.9 3 200 4.6 4. 125 4.6 5 160 4.6 6 200 3.4 > etching$flowrate result anova (result) Analysis of Variance Table Response: uniformity Df Sum Sq Mean Sq F value Pr (>F) flowrate 2 3.6478 1.82389 3.5856 0.05337 Residuals 15 7.6300 0.50867 iii) What conclusion do you make about the hypotheses in (ii)? Use a significance level of a = 0.10. Give a reason for your answer. [2] The researcher ran the TukeyHSD procedure for this data in R. The code used and output produced are shown below. > result2 TukeyHSD (result2) Tukey multiple comparisons of means 95% family-wise confidence level $flowrate diff lwr upr padj 160-125 1.1000000 0.03043646 2.1695635 0.0434544 200-125 0.6166667 -0.45289687 1.6862302 0.3198789 200-160 -0.4833333 -1.55289687 0.5862302 0.4860065 iv) What is the purpose of running this TukeyHSD procedure? What are the hypotheses that are being tested? [3] v) From the TukeyHSD output, what are your conclusions? Use a significance level of a = 0.10. Give a reason for your answer. [3] The researcher went on to produce the following plots in R. > qqnorm (result$res) > qqline (result$res) > plot (result$fit, result$res) Normal Q-Q Plot 0 o 0.5 0.5 Sample Quantiles resultsres 0.0 O -0.5 -2 -1 3.4 3.6 3.8 4.0 42 0 44 2 Theoretical Quantiles resultsfit vi) For each plot provided, explain the specific purpose of the plot. State your conclusions from each plot. b) The article Orthogonal Design for Process Optimization and Its Application to Plasma Etching (Yin GZ, Jillie DW; Solid State Technology; 1987; 30(5):127-132) describes an experiment to determine the effect of C2F6 flow rate on the uniformity of the etch on a silicon wafer used in integrated circuit manufacturing. Three standard flow rates are used in industry, so these three flow rates are used in the experiment. The resulting uniformity (in percent) for six replicates is shown below. 1 Observations C2F6 Flow (SCCM) 1 2 3 4 5 6 125 2.7 4.6 2.6 3.0 3.2 3.8 160 4.9 4.6 5.0 4.2 3.6 4.2 200 4.6 3.4 2.9 3.5 4.1 5.1 A researcher wants to test the hypothesis that the average etch uniformity is the same for the three flow rates. i) Identify the design shown. [1] ii) Write out the hypotheses that the researcher wants to test for this scenario. [2] The data were stored in the etching.csv file. The following code was run in R and the output is shown below. > etching head (etching) flowrate uniformity 1 125 2.7 2 160 4.9 3 200 4.6 4. 125 4.6 5 160 4.6 6 200 3.4 > etching$flowrate result anova (result) Analysis of Variance Table Response: uniformity Df Sum Sq Mean Sq F value Pr (>F) flowrate 2 3.6478 1.82389 3.5856 0.05337 Residuals 15 7.6300 0.50867 iii) What conclusion do you make about the hypotheses in (ii)? Use a significance level of a = 0.10. Give a reason for your answer. [2] The researcher ran the TukeyHSD procedure for this data in R. The code used and output produced are shown below. > result2 TukeyHSD (result2) Tukey multiple comparisons of means 95% family-wise confidence level $flowrate diff lwr upr padj 160-125 1.1000000 0.03043646 2.1695635 0.0434544 200-125 0.6166667 -0.45289687 1.6862302 0.3198789 200-160 -0.4833333 -1.55289687 0.5862302 0.4860065 iv) What is the purpose of running this TukeyHSD procedure? What are the hypotheses that are being tested? [3] v) From the TukeyHSD output, what are your conclusions? Use a significance level of a = 0.10. Give a reason for your answer. [3] The researcher went on to produce the following plots in R. > qqnorm (result$res) > qqline (result$res) > plot (result$fit, result$res) Normal Q-Q Plot 0 o 0.5 0.5 Sample Quantiles resultsres 0.0 O -0.5 -2 -1 3.4 3.6 3.8 4.0 42 0 44 2 Theoretical Quantiles resultsfit vi) For each plot provided, explain the specific purpose of the plot. State your conclusions from each plot
Step by Step Solution
There are 3 Steps involved in it

Get step-by-step solutions from verified subject matter experts