

Question: b. The graph below shows the envelope frontier. Based on the graph below do you agree with the statement Portfolio P(1) and P(2) are two
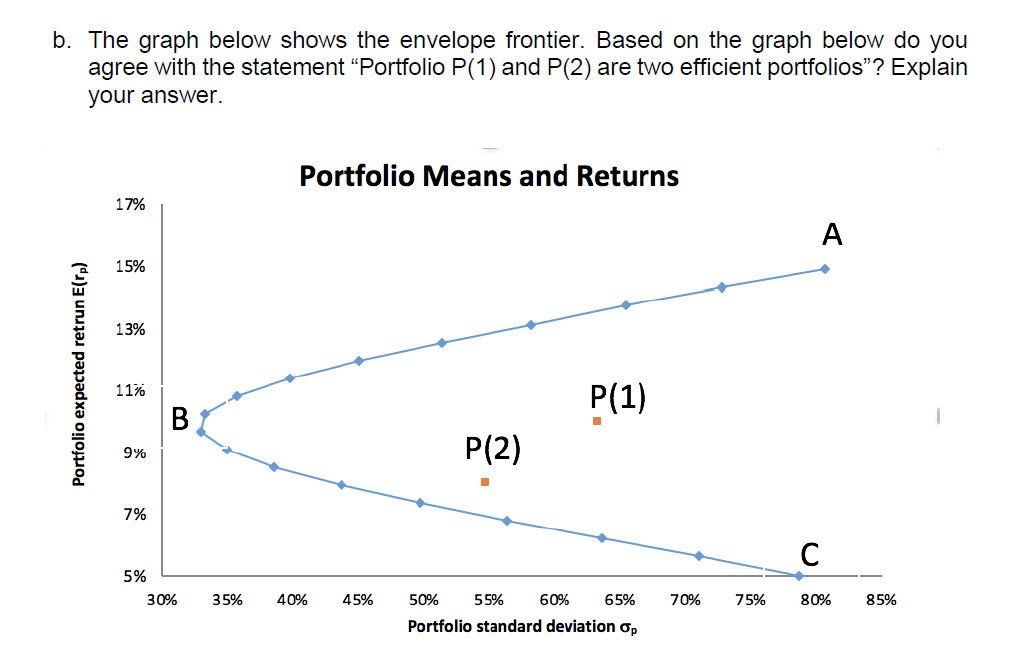
b. The graph below shows the envelope frontier. Based on the graph below do you agree with the statement Portfolio P(1) and P(2) are two efficient portfolios? Explain your answer. Portfolio Means and Returns 17% . 15% 13% Portfolio expected retrun E(rp) 11% P(1) B 9% P(2) 7% C 5% 30% 35% 40% 45% 50% 55% 60% 65% 70% 75% 80% 85% Portfolio standard deviation op
Step by Step Solution
There are 3 Steps involved in it
1 Expert Approved Answer
Step: 1 Unlock

Question Has Been Solved by an Expert!
Get step-by-step solutions from verified subject matter experts
Step: 2 Unlock
Step: 3 Unlock