

Question: b) We are interested in estimating and constructing a confidence interval ? for the percentage change in price when a 200-square-foot bedroom is? ? added


b) We are interested in estimating and constructing a confidence interval
?
for the percentage change in price when a 200-square-foot bedroom is?
?
added to a house. How can you construct this confidence interval??
?
What assumptions are needed to do so? State all assumptions and ex-?
?
plain why you need the assumptions. Calculate the estimates and con-?
?
fidence interval, and interpret them.?
?
(c) In order to construct a confidence interval we need to estimate a stan-?
?
dard error for the estimate in part (b). Provide the way to estimate the?
?
standard error using another multiple regression model (Hint: Define a?
?
parameter which represents the above estimator (in part (b)). Then one?
?
can estimate a standard error using this relationship with another multi-?
?
ple regression model). Based on the estimated standard error, construct?
?
a 95% confidence interval.?
?
(d) Suppose now u does not follow normal distribution any more. Elabo-?
?
rate how can you calculate the confidence interval in (b) and (c). And?
?
calculate such confidence interval using R.?
?
3. Suppose that the model?
?
pctstck = ?0 + ?1funds + ?2risktol + u,?
?
satisfies the first four Gauss-Markov assumptions, where pctstck is the per-?
?
centage of a worker's pension invested in the stock market, funds is the num-?
?
ber of mutual funds that the worker can choose from, and risktol is some?
?
measure of risk tolerance (larger risktol means the person has a higher tol-?
?
erance for risk). If funds and risktol are positively correlated, what are the?
?
bias and inconsistency in ???
?
1, the slope coefficient in the simple regression of?
?
pctstck on funds? Moreover, how do you interpret the estimates you obtain?
?
from this simple regression? [You SHOULD answer these questions crystal?
?
clear.?
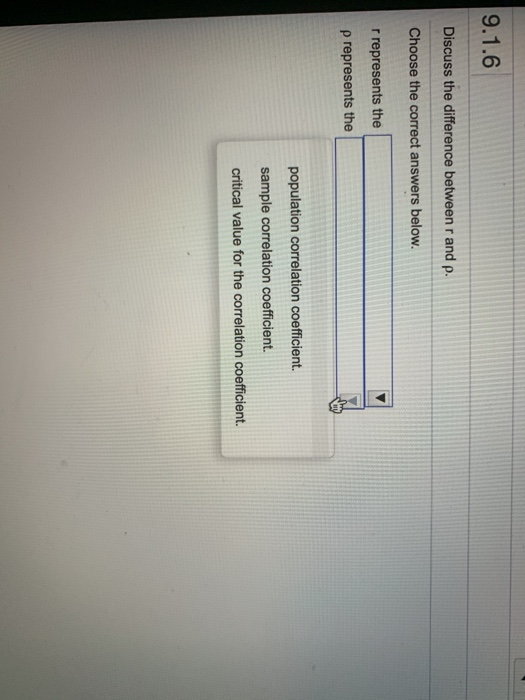
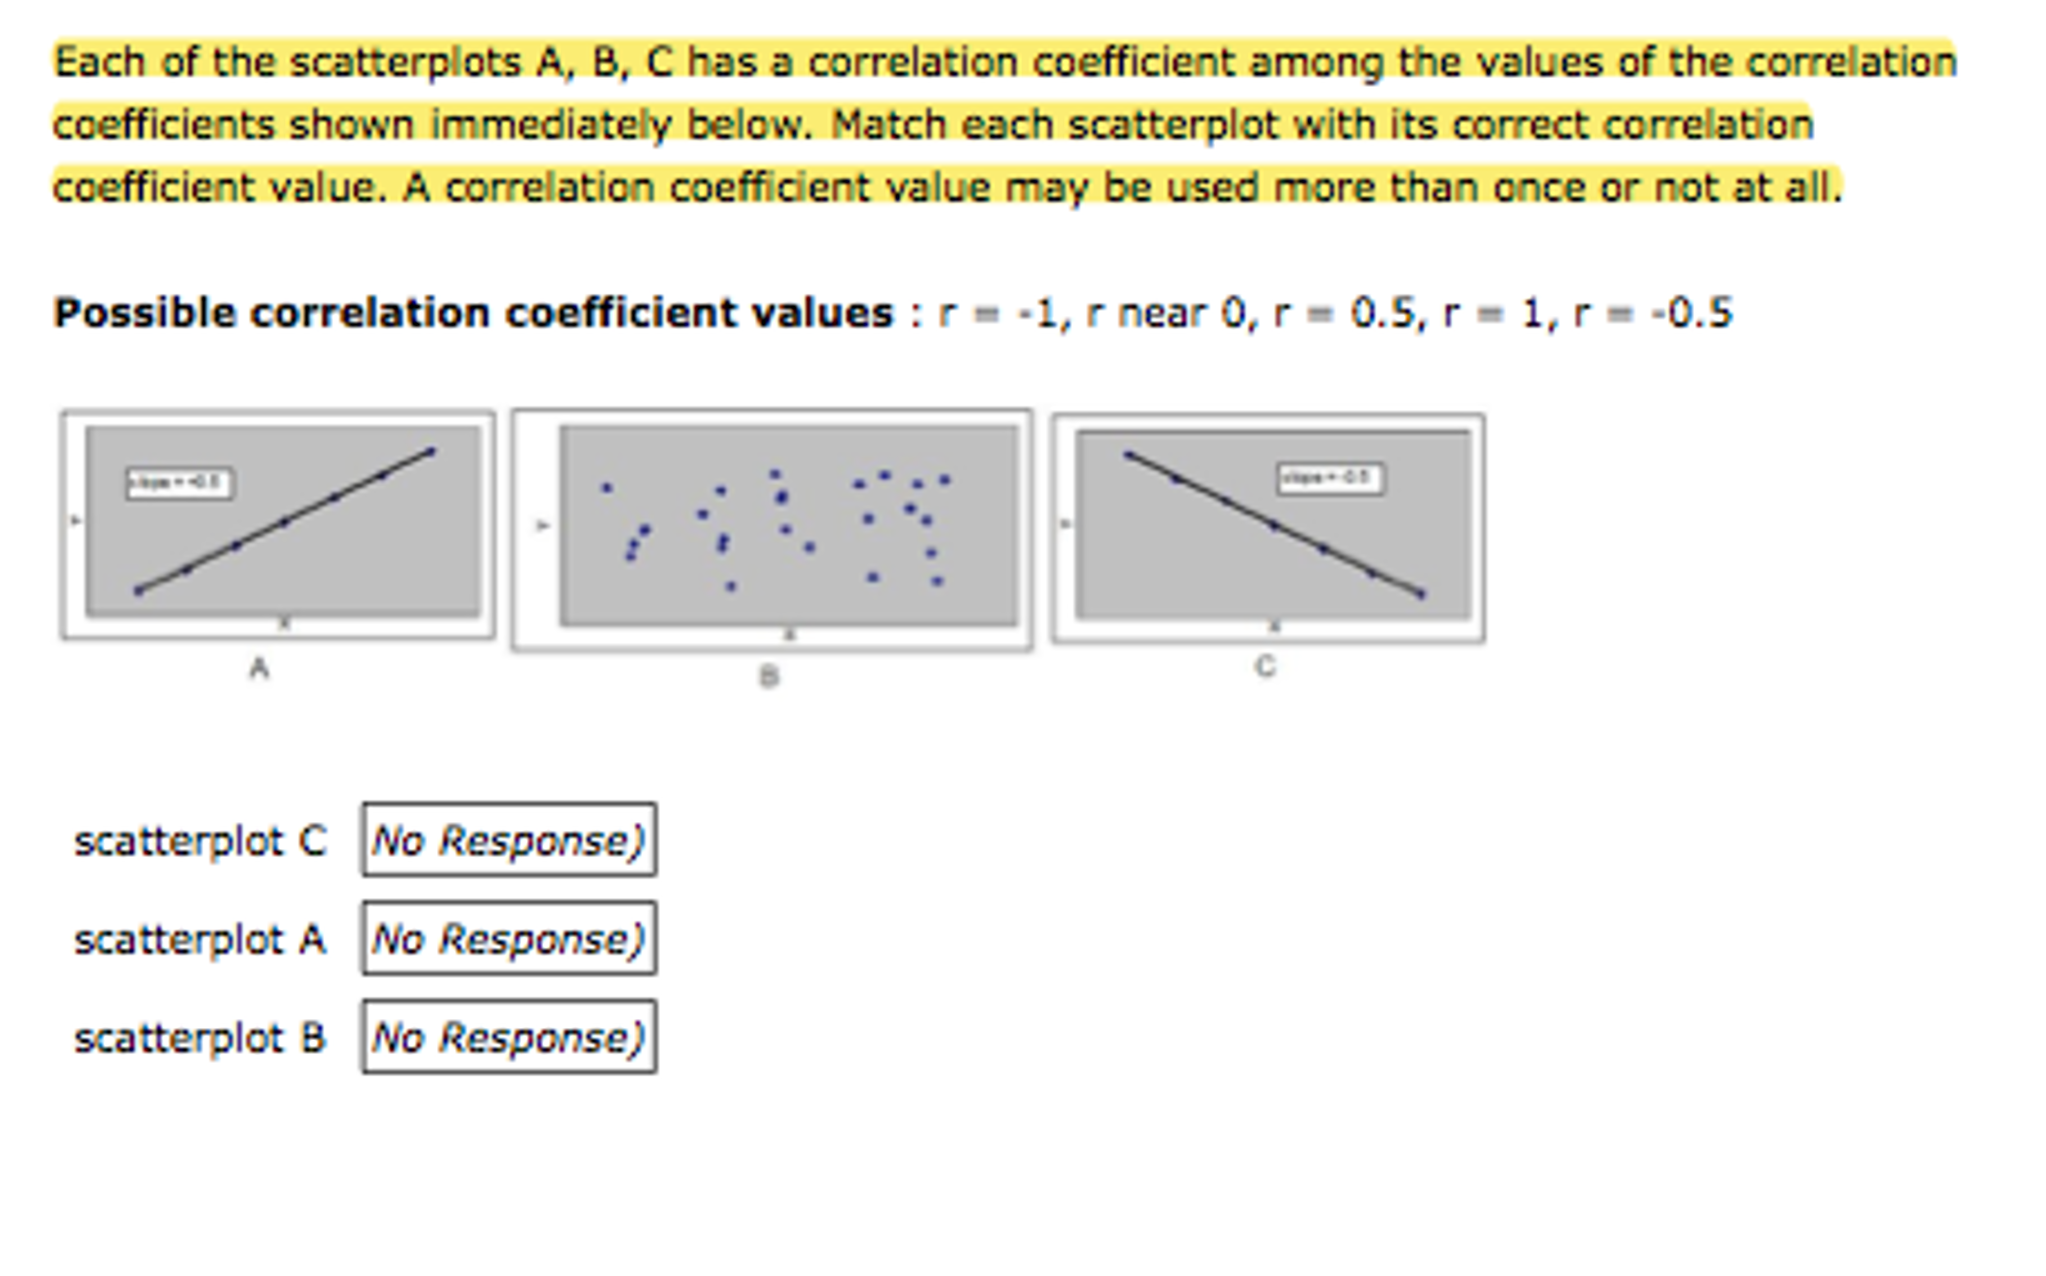
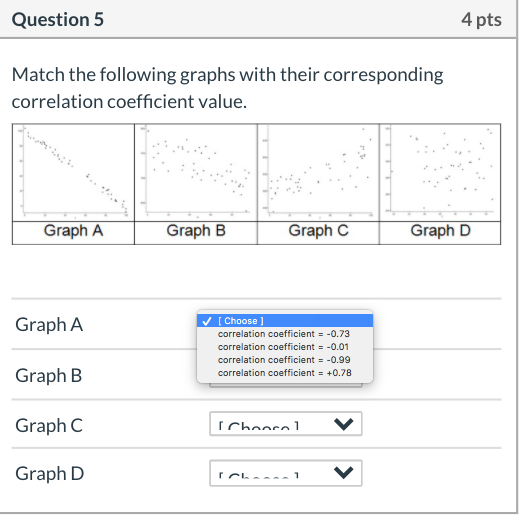
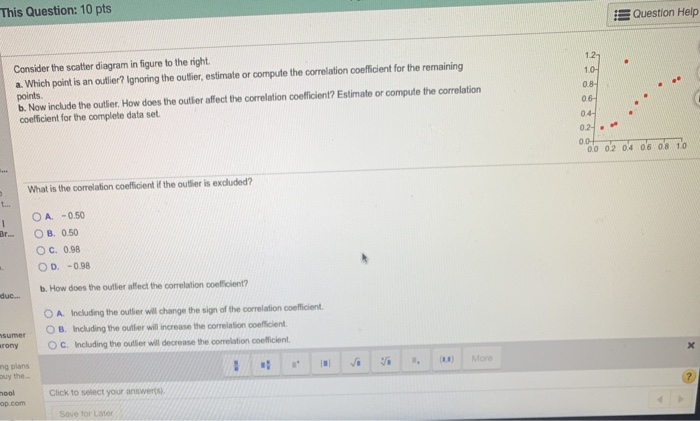
9.1.6 Discuss the difference between r and p. Choose the correct answers below. r represents the p represents the population correlation coefficient. sample correlation coefficient. critical value for the correlation coefficient.Each of the scatterplots A, B, C has a correlation coefficient among the values of the correlation coefficients shown immediately below. Match each scatterplot with its correct correlation coefficient value. A correlation coefficient value may be used more than once or not at all. Possible correlation coefficient values : r = -1, r near 0, r = 0.5, r = 1, r = -0.5 C scatterplot C No Response) scatterplot A No Response) scatterplot B No Response)Question 5 4 pts Match the following graphs with their corresponding correlation coefficient value. Graph A Graph B Graph C Graph D Graph A [ Choose correlation coefficient = -0.73 correlation coefficient = -0.01 correlation coefficient = -0.99 Graph B correlation coefficient = +0.78 Graph C I HAAPA 1 V Graph D VThis Question: 10 pts Question Help Consider the scatter diagram in figure to the right. a. Which point is an outlier? Ignoring the outlier, estimate or compute the correlation coefficient for the remaining 127 points. b. Now include the outlier. How does the outher affect the correlation coefficient? Estimate or compute the correlation coefficient for the complete data set. 06- 04- 02- 0,0- DO 02 04 06 08 10 What is the comelation coefficient if the outlier is excluded? O A -0.50 O B. 0.50 O C. 0.98 O D. - 0.98 duC.. b. How does the outlier affect the correlation coefficient? O A Including the outlier wil change the sign of the correlation coefficient. sumer O B. Including the outber will increase the correlation confficient. inory O C. Including the outlier will decrease the correlation coefficient. 10 plans More 10-0 Glick to select your answers op.com Save for Later
Step by Step Solution
There are 3 Steps involved in it

Get step-by-step solutions from verified subject matter experts