

Question: Back to Assignment Attempts Average / 5 1. Market equilibrium with demand and supply functions Consider the market for sleds. Suppose the quantity of sleds
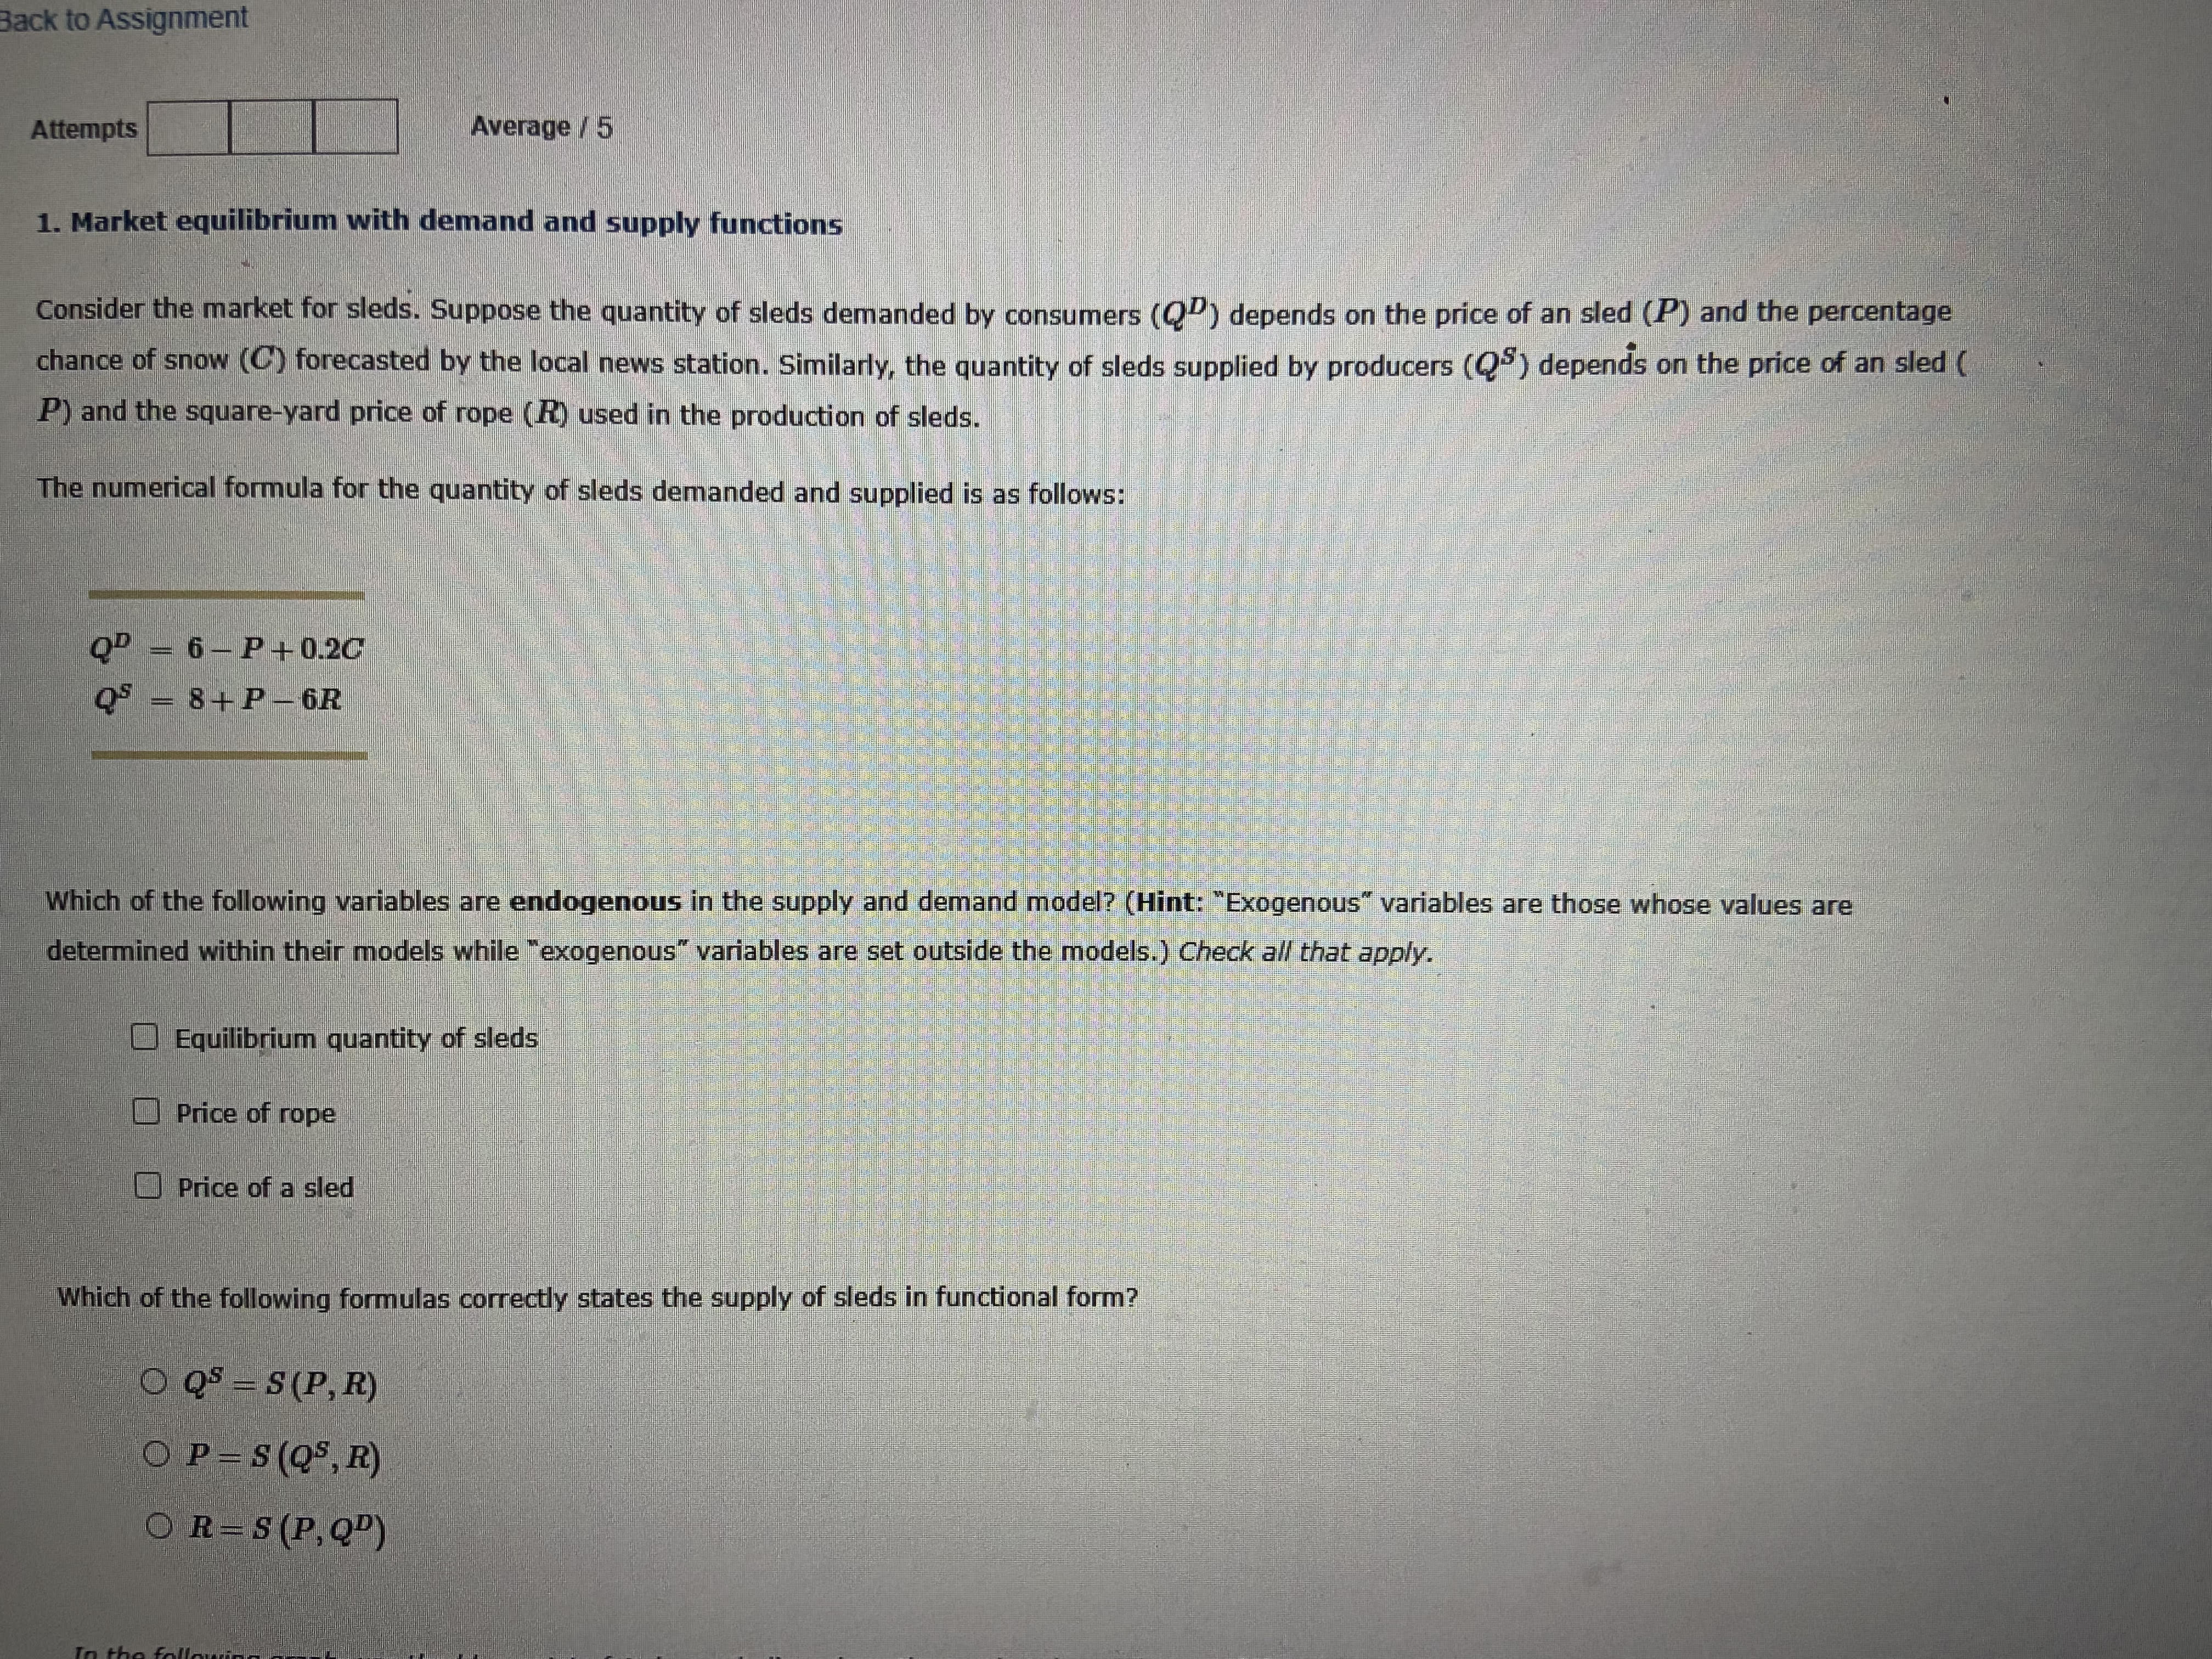
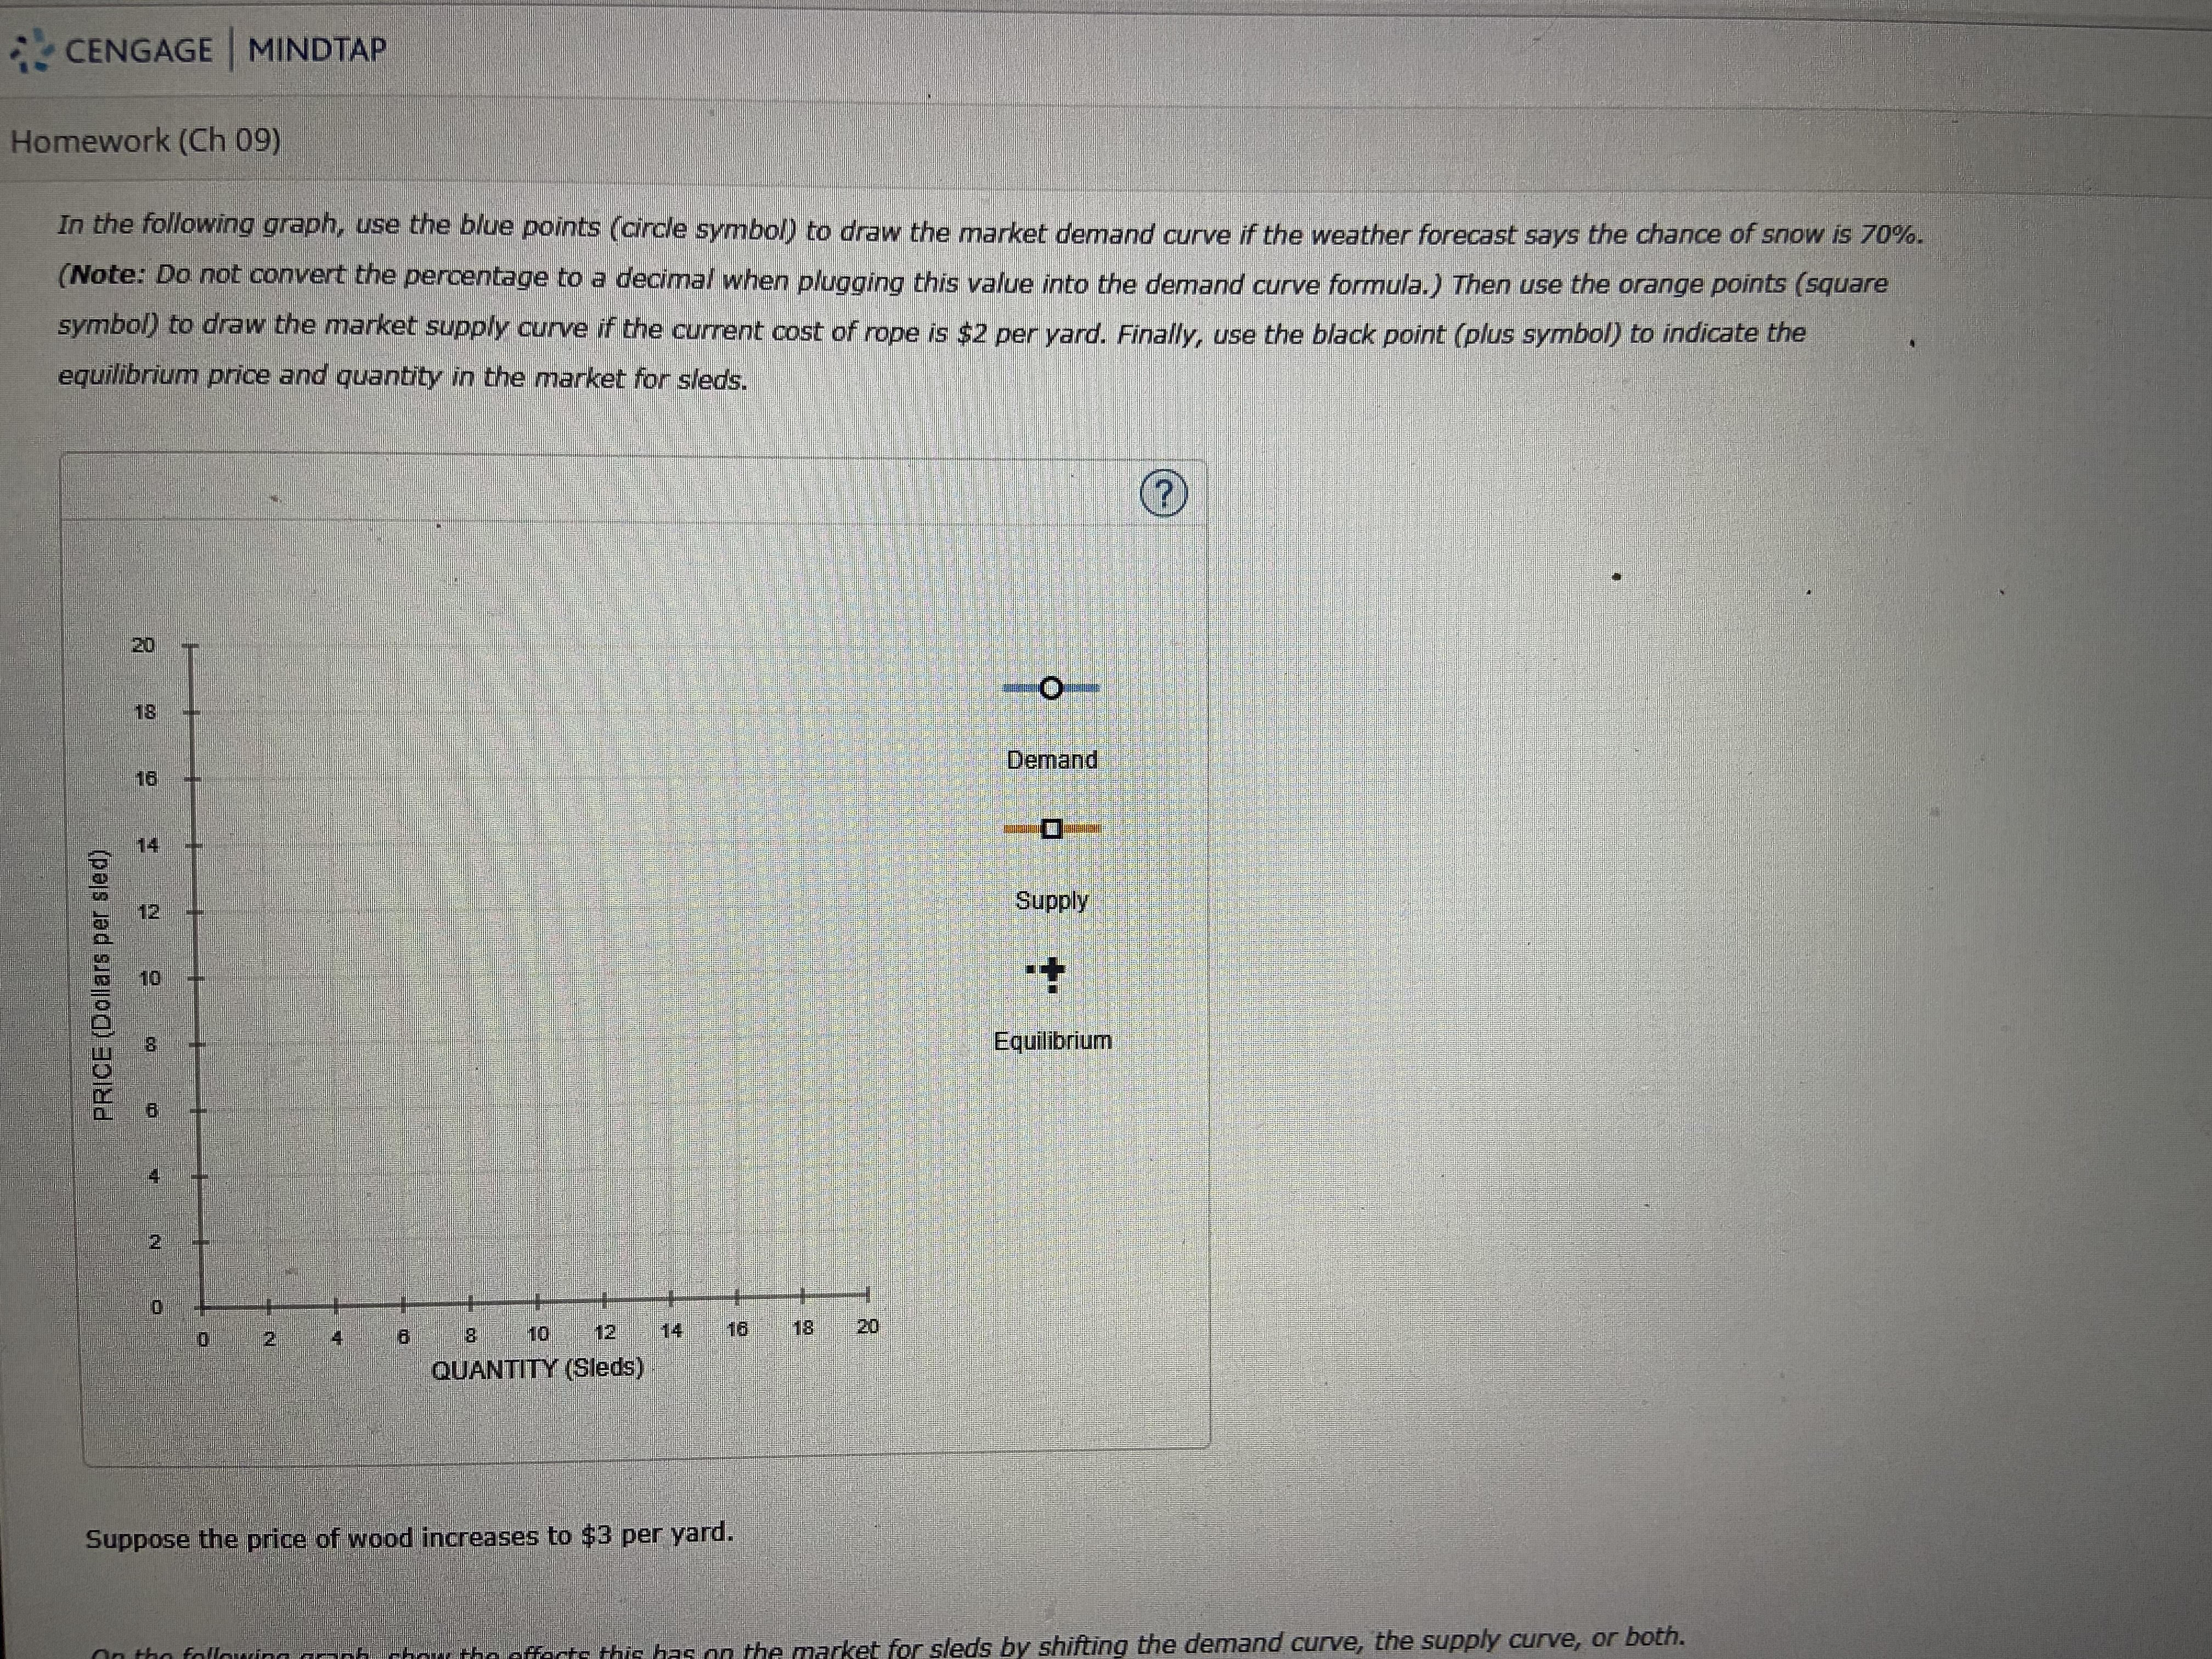
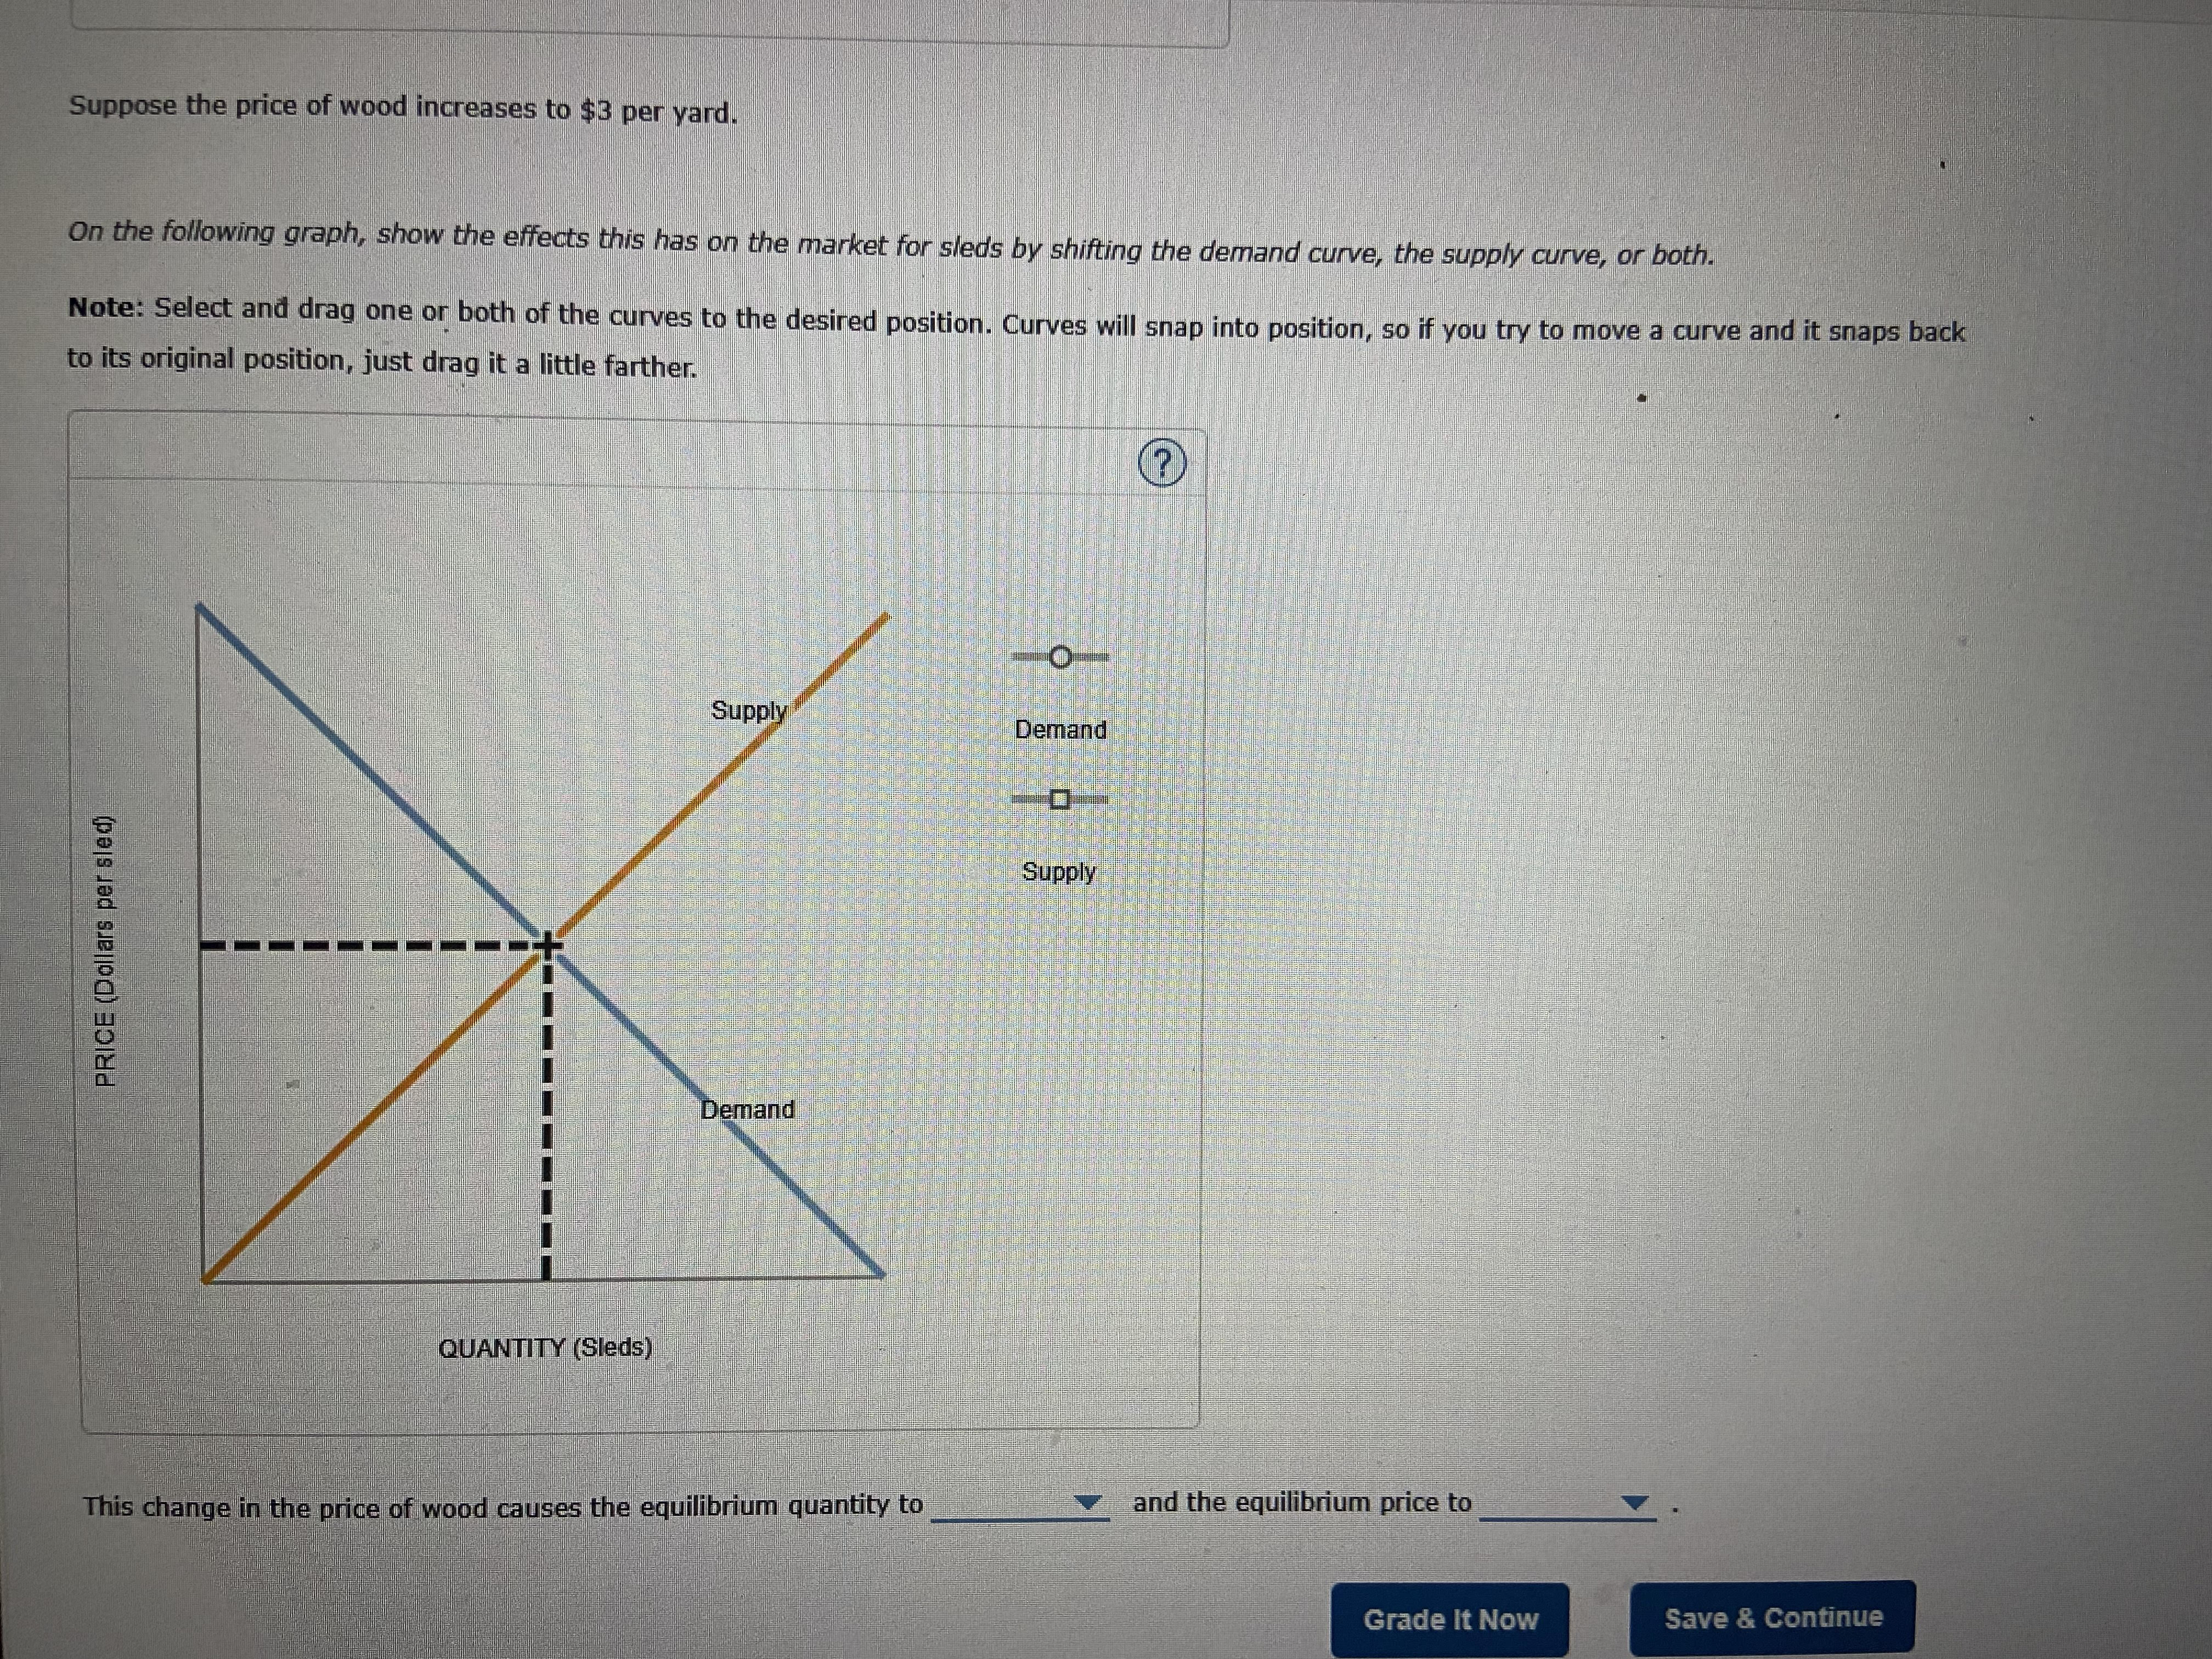
Back to Assignment Attempts Average / 5 1. Market equilibrium with demand and supply functions Consider the market for sleds. Suppose the quantity of sleds demanded by consumers (Q") depends on the price of an sled (P) and the percentage chance of snow (C) forecasted by the local news station. Similarly, the quantity of sleds supplied by producers (Q") depends on the price of an sled ( P) and the square-yard price of rope ( R) used in the production of sleds. The numerical formula for the quantity of sleds demanded and supplied is as follows: 6 - P + 0.20 OS - 8+P - 6R Which of the following variables are endogenous in the supply and demand model? (Hint: "Exogenous" variables are those whose values are determined within their models while "exogenous" variables are set outside the models.) Check all that apply. Equilibrium quantity of sleds Price of rope Price of a sled Which of the following formulas correctly states the supply of sleds in functional form? O QS - S(P, R) O P - S (Q5, R) O R - S (P, QD)CENGAGE |MINDTAP Homework (Ch 09) In the following graph, use the blue points (circle symbol) to draw the market demand curve if the weather forecast says the chance of snow is 70%. (Note: Do not convert the percentage to a decimal when plugging this value into the demand curve formula.) Then use the orange points (square symbol) to draw the market supply curve if the current cost of rope is $2 per yard. Finally, use the black point (plus symbol) to indicate the equilibrium price and quantity in the market for sleds. 20 18 Demand 16 14 Supply PRICE (Dollars per sled) Equilibrium 10 12 QUANTITY (Sleds) Suppose the price of wood increases to $3 per yard. sleds by shifting the demand curve, the supply curve, or both.Suppose the price of wood increases to $3 per yard. On the following graph, show the effects this has on the market for sleds by shifting the demand curve, the supply curve, or both. Note: Select and drag one or both of the curves to the desired position. Curves will snap into position, so if you try to move a curve and it snaps back to its original position, just drag it a little farther. Supply Demand Supply PRICE (Dollars per sled) Demand QUANTITY (Sleds) This change in the price of wood causes the equilibrium quantity to and the equilibrium price to Grade It Now Save & Continue
Step by Step Solution
There are 3 Steps involved in it

Get step-by-step solutions from verified subject matter experts