

Question: Background Table 1 - Some soil properties table [ [ Parameter , Clay,Limestone, ] , [ Unit weight, table [ [ Above water
Background Table Some soil properties
tableParameterClay,Limestone,Unit weight,tableAbove watertablekNmkNmtableBelow watertablekNmkNmtableStiffness in vertical directionrelationship between vertical stressand straintable MPa underundrainedconditionstable GPa drainedand undrainedconditions
Table Oedometer settlement results for kPa load step.
Table Void ratios at end of each oedometer load step
As part of the construction of High Speed HS relandscaping is required to ensure track gradients do not exceed limit values. Soil removal may result in heave ie upwards movement of the soil surface. This must be within specific tolerances to ensure the rail track does not deform too much while operational.
Your job is to predict changes in ground surface levels over time for a location along the HS trajectory.
Ground profile
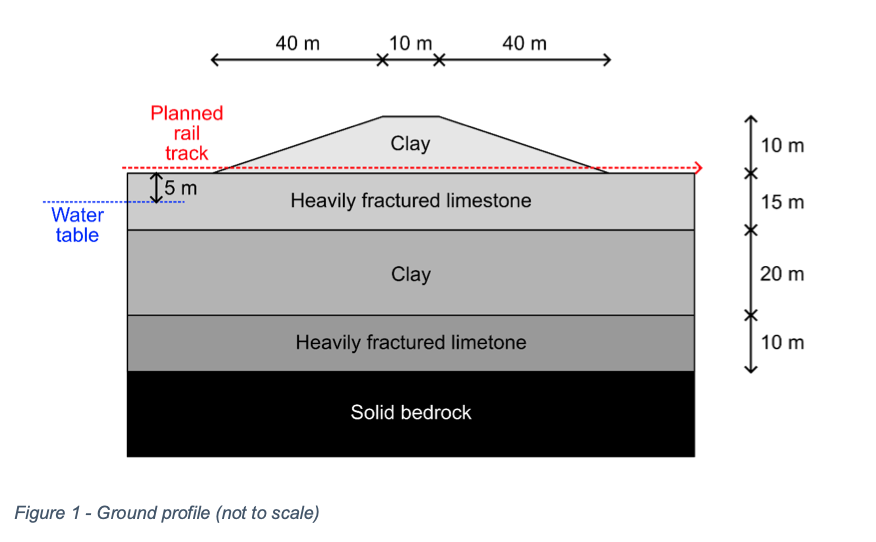
The ground profile consists of layers of relatively impermeable clays and very permeable, heavy fractures limestones see Figure The ground water table is located at m depth. Some soil properties for these layers are given in Table An oedometer test was conducted on a clay sample taken from the middle of the m thick clay layer. The data for this test can be found in Tables and The oedometer sample diameter was mm and its initial thickness was mm
As part of the rail construction, the m high clay hill on the surface was entirely excavated to allow construction of a level railway line, see Figure
Calculate heave resulting from the removal of the clay hill as function of time at the location where you think heave will be largest. Using your calculations, draw a graph showing how the heave changes over time at this location.
Draw a graph showing how the longterm heave varies along the rail track. Estimate the largest gradient anywhere along the rail track, and indicate where along the track these may occur.
Comment on your predictions. How reliable and representative do you think your predictions are?
You may use the following simplifying assumptions by:
ignoring any heave associated with soil creep.
assuming planestrain conditions.
assuming any soil movements are purely vertical. In other words, you may
assume that horizontal strains are zero.
Have a single excel file with supporting calculations.Figure Ground profile not to scale
Step by Step Solution
There are 3 Steps involved in it
1 Expert Approved Answer
Step: 1 Unlock

Question Has Been Solved by an Expert!
Get step-by-step solutions from verified subject matter experts
Step: 2 Unlock
Step: 3 Unlock