

Question: Balance Sheet - Microsoft Corporation (MSFT) Total Assets Current Assets Cash, Cash Equivalents & Short Term Investments Cash and Cash Equivalents Other Short Term Investments
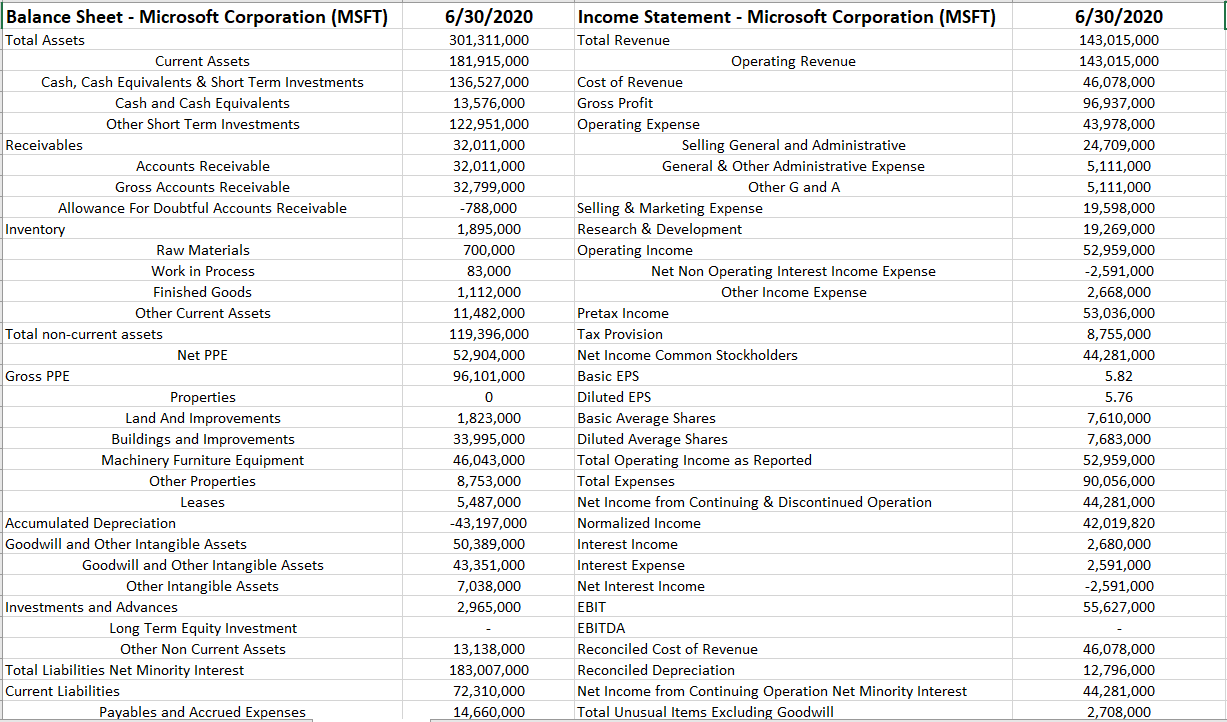
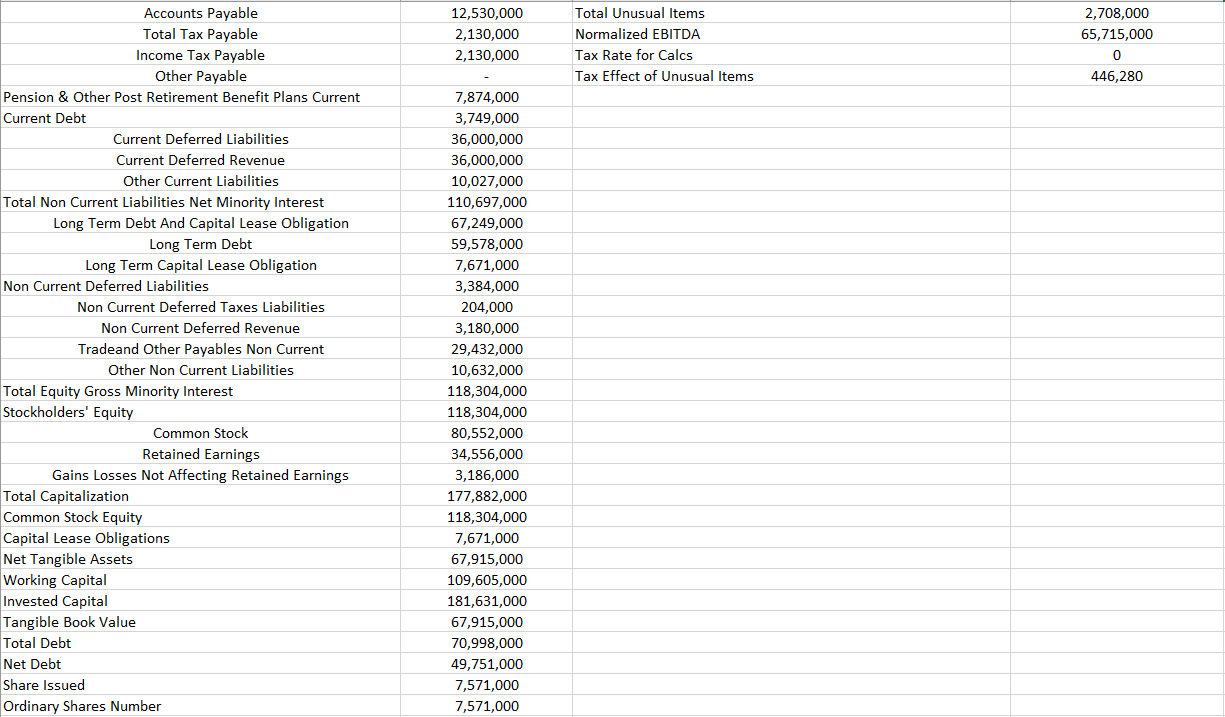
Balance Sheet - Microsoft Corporation (MSFT) Total Assets Current Assets Cash, Cash Equivalents & Short Term Investments Cash and Cash Equivalents Other Short Term Investments Receivables Accounts Receivable Gross Accounts Receivable Allowance For Doubtful Accounts Receivable Inventory Raw Materials Work in Process Finished Goods Other Current Assets Total non-current assets Net PPE Gross PPE Properties Land And Improvements Buildings and Improvements Machinery Furniture Equipment Other Properties Leases Accumulated Depreciation Goodwill and Other Intangible Assets Goodwill and Other Intangible Assets Other Intangible Assets Investments and Advances Long Term Equity Investment Other Non Current Assets Total Liabilities Net Minority Interest Current Liabilities Payables and Accrued Expenses 6/30/2020 301,311,000 181,915,000 136,527,000 13,576,000 122,951,000 32,011,000 32,011,000 32,799,000 -788,000 1,895,000 700,000 83,000 1,112,000 11,482,000 119,396,000 52,904,000 96,101,000 0 1,823,000 33,995,000 46,043,000 8,753,000 5,487,000 -43,197,000 50,389,000 43,351,000 7,038,000 2,965,000 Income Statement - Microsoft Corporation (MSFT) Total Revenue Operating Revenue Cost of Revenue Gross Profit Operating Expense Selling General and Administrative General & Other Administrative Expense Other G and A Selling & Marketing Expense Research & Development Operating Income Net Non Operating Interest Income Expense Other Income Expense Pretax Income Tax Provision Net Income Common Stockholders Basic EPS Diluted EPS Basic Average Shares Diluted Average Shares Total Operating Income as Reported Total Expenses Net Income from Continuing & Discontinued Operation Normalized Income Interest Income Interest Expense Net Interest Income EBIT EBITDA Reconciled Cost of Revenue Reconciled Depreciation Net Income from Continuing Operation Net Minority Interest Total Unusual Items Excluding Goodwill 6/30/2020 143,015,000 143.015.000 46,078,000 96,937,000 43,978,000 24,709,000 5,111,000 5,111,000 19,598,000 19,269,000 52,959,000 -2,591,000 2,668,000 53,036,000 8,755,000 44,281,000 5.82 5.76 7,610,000 7,683,000 52,959,000 90,056,000 44,281,000 42,019,820 2,680,000 2,591,000 -2,591,000 55,627,000 13,138,000 183,007,000 72,310,000 14,660,000 46,078,000 12,796,000 44,281,000 2,708,000 12,530,000 2,130,000 2,130,000 2,708,000 65,715,000 Total Unusual Items Normalized EBITDA Tax Rate for Calcs Tax Effect of Unusual Items 0 446,280 Accounts Payable Total Tax Payable Income Tax Payable Other Payable Pension & Other Post Retirement Benefit Plans Current Current Debt Current Deferred Liabilities Current Deferred Revenue Other Current Liabilities Total Non Current Liabilities Net Minority Interest Long Term Debt And Capital Lease Obligation Long Term Debt Long Term Capital Lease Obligation Non Current Deferred Liabilities Non Current Deferred Taxes Liabilities Non Current Deferred Revenue Tradeand Other Payables Non Current Other Non Current Liabilities Total Equity Gross Minority Interest Stockholders' Equity Common Stock Retained Earnings Gains Losses Not Affecting Retained Earnings Total Capitalization Common Stock Equity Capital Lease Obligations Net Tangible Assets Working Capital Invested Capital Tangible Book Value Total Debt Net Debt Share Issued Ordinary Shares Number 7,874,000 3,749,000 36,000,000 36,000,000 10,027,000 110,697,000 67,249,000 59,578,000 7,671,000 3,384,000 204,000 3,180,000 29,432,000 10,632,000 118,304,000 118,304,000 80,552,000 34,556,000 3,186,000 177,882,000 118,304,000 7,671,000 67,915,000 109,605,000 181,631,000 67,915,000 70,998,000 49,751,000 7,571,000 7,571,000 (1) Conduct a financial ratio analysis of the company. (1) Estimate the weights of capital (debt, preferred stock, and common stock) for the company. (2) Estimate the before-tax and after-tax component cost of debt for the firm. (3) Estimate the component cost of preferred stock (if applicable) for the firm. (4) Estimate the component cost of common equity using CAPM for the firm. (5) Compute the firm's weighted average cost of capital (WACC). Discuss your findings. Balance Sheet - Microsoft Corporation (MSFT) Total Assets Current Assets Cash, Cash Equivalents & Short Term Investments Cash and Cash Equivalents Other Short Term Investments Receivables Accounts Receivable Gross Accounts Receivable Allowance For Doubtful Accounts Receivable Inventory Raw Materials Work in Process Finished Goods Other Current Assets Total non-current assets Net PPE Gross PPE Properties Land And Improvements Buildings and Improvements Machinery Furniture Equipment Other Properties Leases Accumulated Depreciation Goodwill and Other Intangible Assets Goodwill and Other Intangible Assets Other Intangible Assets Investments and Advances Long Term Equity Investment Other Non Current Assets Total Liabilities Net Minority Interest Current Liabilities Payables and Accrued Expenses 6/30/2020 301,311,000 181,915,000 136,527,000 13,576,000 122,951,000 32,011,000 32,011,000 32,799,000 -788,000 1,895,000 700,000 83,000 1,112,000 11,482,000 119,396,000 52,904,000 96,101,000 0 1,823,000 33,995,000 46,043,000 8,753,000 5,487,000 -43,197,000 50,389,000 43,351,000 7,038,000 2,965,000 Income Statement - Microsoft Corporation (MSFT) Total Revenue Operating Revenue Cost of Revenue Gross Profit Operating Expense Selling General and Administrative General & Other Administrative Expense Other G and A Selling & Marketing Expense Research & Development Operating Income Net Non Operating Interest Income Expense Other Income Expense Pretax Income Tax Provision Net Income Common Stockholders Basic EPS Diluted EPS Basic Average Shares Diluted Average Shares Total Operating Income as Reported Total Expenses Net Income from Continuing & Discontinued Operation Normalized Income Interest Income Interest Expense Net Interest Income EBIT EBITDA Reconciled Cost of Revenue Reconciled Depreciation Net Income from Continuing Operation Net Minority Interest Total Unusual Items Excluding Goodwill 6/30/2020 143,015,000 143.015.000 46,078,000 96,937,000 43,978,000 24,709,000 5,111,000 5,111,000 19,598,000 19,269,000 52,959,000 -2,591,000 2,668,000 53,036,000 8,755,000 44,281,000 5.82 5.76 7,610,000 7,683,000 52,959,000 90,056,000 44,281,000 42,019,820 2,680,000 2,591,000 -2,591,000 55,627,000 13,138,000 183,007,000 72,310,000 14,660,000 46,078,000 12,796,000 44,281,000 2,708,000 12,530,000 2,130,000 2,130,000 2,708,000 65,715,000 Total Unusual Items Normalized EBITDA Tax Rate for Calcs Tax Effect of Unusual Items 0 446,280 Accounts Payable Total Tax Payable Income Tax Payable Other Payable Pension & Other Post Retirement Benefit Plans Current Current Debt Current Deferred Liabilities Current Deferred Revenue Other Current Liabilities Total Non Current Liabilities Net Minority Interest Long Term Debt And Capital Lease Obligation Long Term Debt Long Term Capital Lease Obligation Non Current Deferred Liabilities Non Current Deferred Taxes Liabilities Non Current Deferred Revenue Tradeand Other Payables Non Current Other Non Current Liabilities Total Equity Gross Minority Interest Stockholders' Equity Common Stock Retained Earnings Gains Losses Not Affecting Retained Earnings Total Capitalization Common Stock Equity Capital Lease Obligations Net Tangible Assets Working Capital Invested Capital Tangible Book Value Total Debt Net Debt Share Issued Ordinary Shares Number 7,874,000 3,749,000 36,000,000 36,000,000 10,027,000 110,697,000 67,249,000 59,578,000 7,671,000 3,384,000 204,000 3,180,000 29,432,000 10,632,000 118,304,000 118,304,000 80,552,000 34,556,000 3,186,000 177,882,000 118,304,000 7,671,000 67,915,000 109,605,000 181,631,000 67,915,000 70,998,000 49,751,000 7,571,000 7,571,000 (1) Conduct a financial ratio analysis of the company. (1) Estimate the weights of capital (debt, preferred stock, and common stock) for the company. (2) Estimate the before-tax and after-tax component cost of debt for the firm. (3) Estimate the component cost of preferred stock (if applicable) for the firm. (4) Estimate the component cost of common equity using CAPM for the firm. (5) Compute the firm's weighted average cost of capital (WACC). Discuss your findings
Step by Step Solution
There are 3 Steps involved in it

Get step-by-step solutions from verified subject matter experts