

Question: Bar graphs can be used to show comparisons and / or trends between different categories of data. They use horizontal or vertical rectangular bars whose
Bar graphs can be used to show comparisons andor trends between different categories of data. They use horizontal or vertical rectangular bars whose heights are proportional to the values of some quantity. They are best used when you are trying to compare sets of data; they are also useful when you have qualitative variables, such as different categories of colors or smells. Bar charts are an effective way of displaying the proportions or parts of something being studied, just like pie charts.
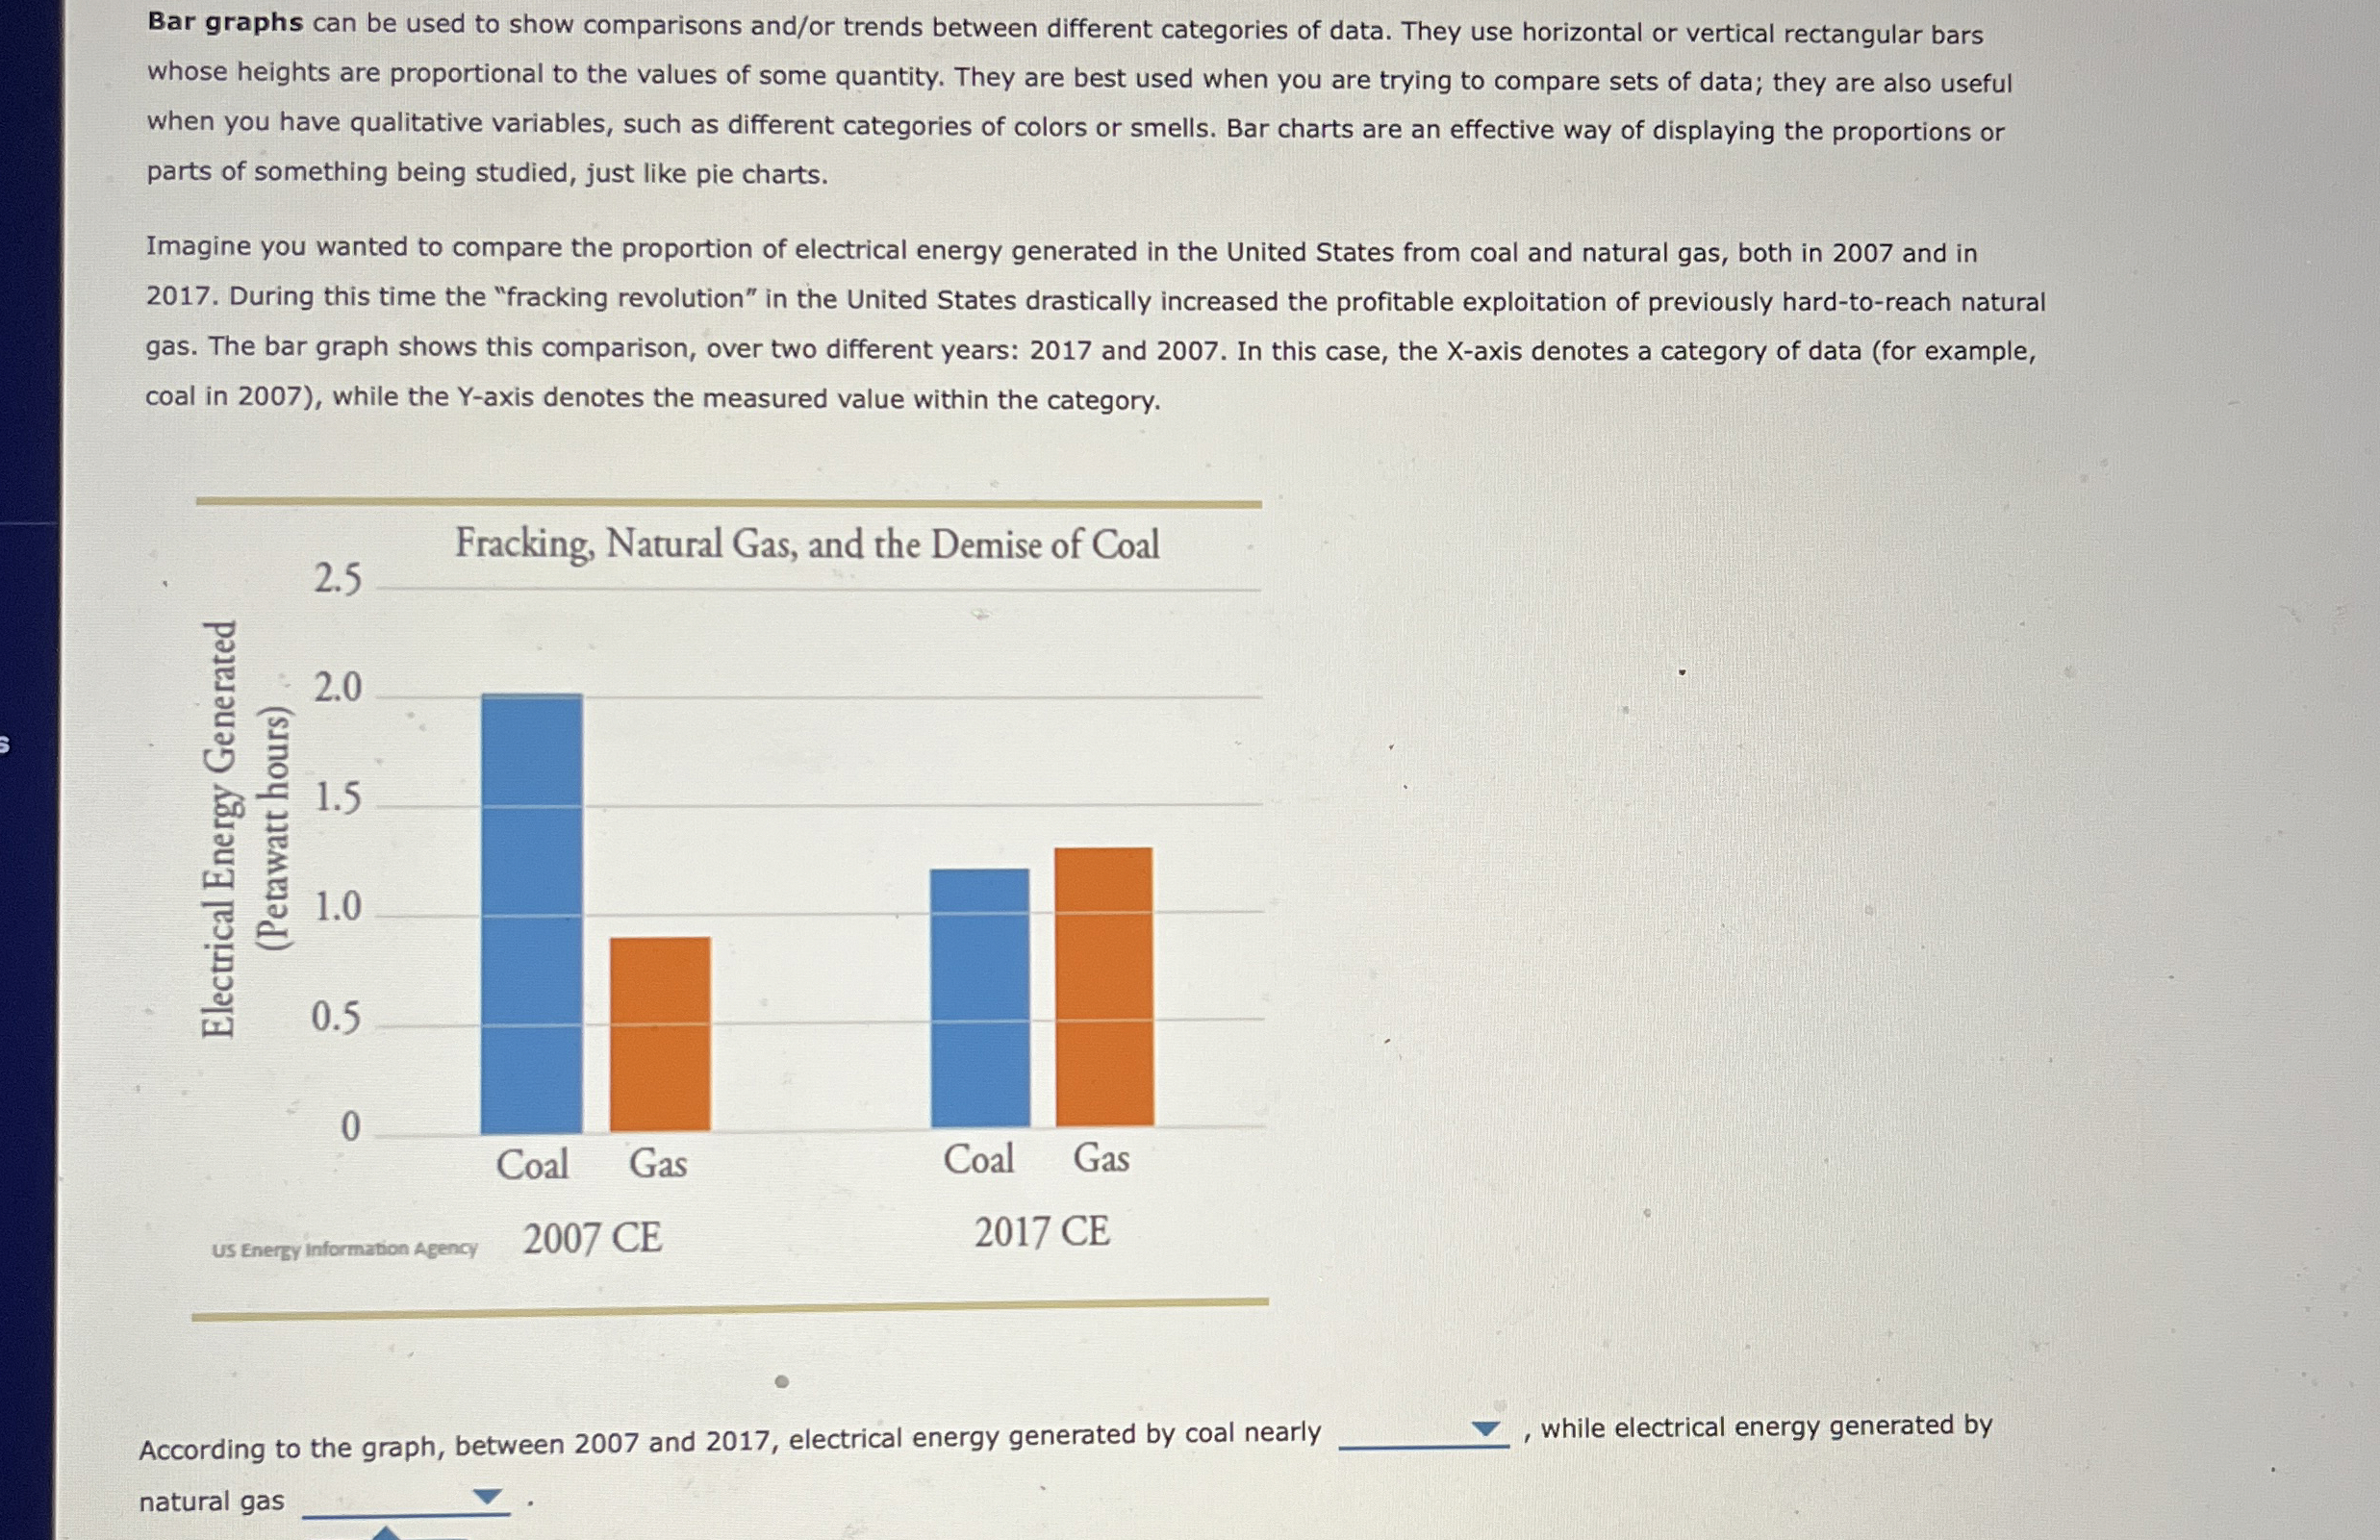
Imagine you wanted to compare the proportion of electrical energy generated in the United States from coal and natural gas, both in and in During this time the "fracking revolution" in the United States drastically increased the profitable exploitation of previously hardtoreach natural gas. The bar graph shows this comparison, over two different years: and In this case, the Xaxis denotes a category of data for example, coal in while the axis denotes the measured value within the category.
According to the graph, between and electrical energy generated by coal nearly while electrical energy generated by natural gas
Step by Step Solution
There are 3 Steps involved in it
1 Expert Approved Answer
Step: 1 Unlock

Question Has Been Solved by an Expert!
Get step-by-step solutions from verified subject matter experts
Step: 2 Unlock
Step: 3 Unlock