

Question: Base on the the Q1 income statement, the statement are shown for 2019 & 2020 in the picture below. It is estimated that for year
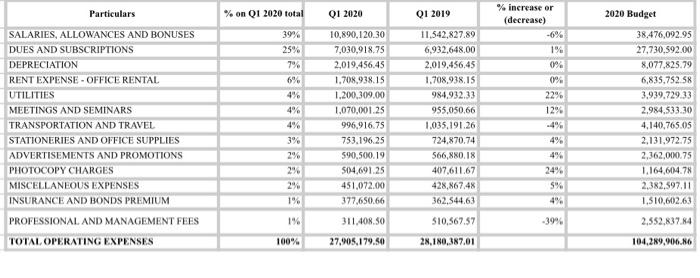
% on Q1 2020 total Q1 2020 Q1 2019 Particulars SALARIES, ALLOWANCES AND BONUSES DUES AND SUBSCRIPTIONS DEPRECIATION RENT EXPENSE - OFFICE RENTAL UTILITIES MEETINGS AND SEMINARS TRANSPORTATION AND TRAVEL STATIONERIES AND OFFICE SUPPLIES ADVERTISEMENTS AND PROMOTIONS PHOTOCOPY CHARGES MISCELLANEOUS EXPENSES INSURANCE AND BONDS PREMIUM PROFESSIONAL AND MANAGEMENT FEES TOTAL OPERATING EXPENSES 39% 25% 7% 6% 4% 4% 4% 3% 2% 2% 2% 1% 10,890, 120.30 7,030,918.75 2,019,456,45 1.708.938.15 1.200,309.00 1.070,001.25 996,916.75 753.196.25 590,500.19 504,691.25 451,072.00 377,650.66 11,542,827.89 6,932,648,00 2,019,456,45 1.708,938,15 984,932.33 955,050,66 1,035.191.26 724.870.74 566,880.18 407,611,67 428,867,4% 362,544.63 % increase or (decrease) -6% 1% 0% 0% 22% 12% -4% 2020 Budget 38.476,092.95 27,730.592.00 8,077.825.79 6,835.752.58 3.939.729.33 2,984,533.30 4,140,765.OS 2,131.972.75 2,362,000.75 1.164,604.78 2,382,597,11 1.510,602.63 24% 5% 4% 1% 311.408.50 510,567.57 -3994 2,352,837.84 100% 27,905, 179.50 28,180,387.01 104,289,906.86
Step by Step Solution
There are 3 Steps involved in it

Get step-by-step solutions from verified subject matter experts