Question: Based on the above information regarding McDonald's (consider only the company's performance prior to COVID-19), how would you classify McDonald's based on the growth-share (BCG)
Based on the above information regarding McDonald's (consider only the company's performance prior to COVID-19), how would you classify McDonald's based on the growth-share (BCG) matrix (star, question mark, cash cow, or dog)? Justify your classification based on the data provided! (200-250 words if possible)
Don't leave any details out.
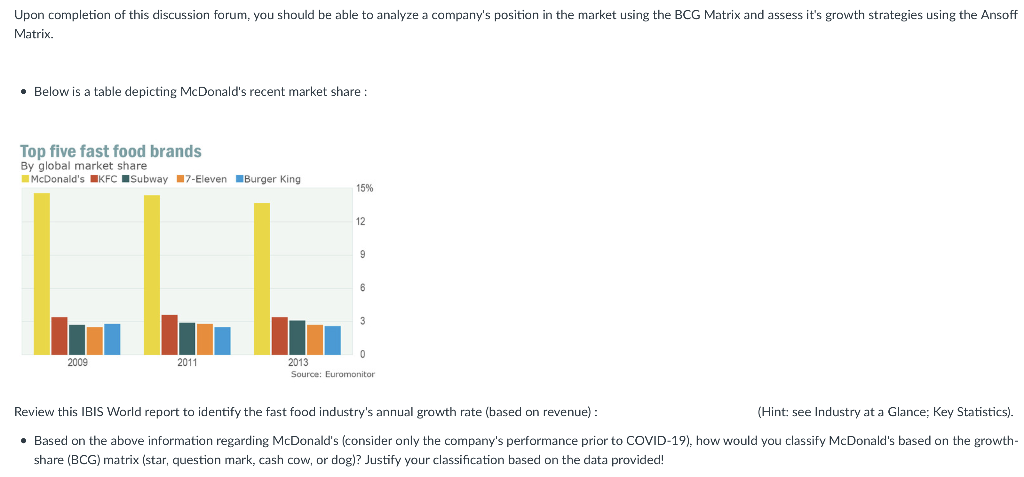
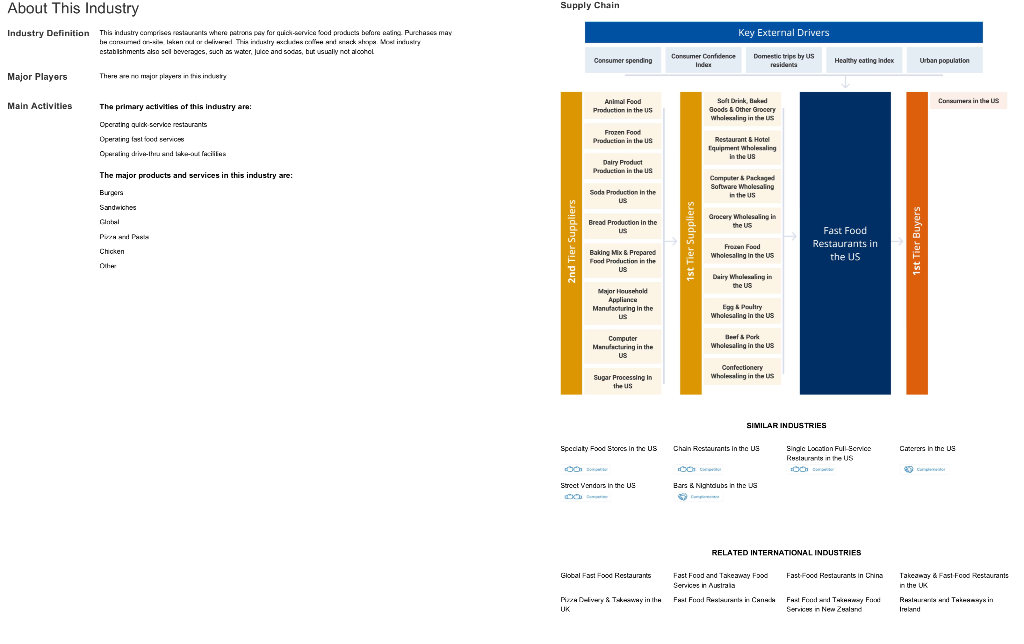
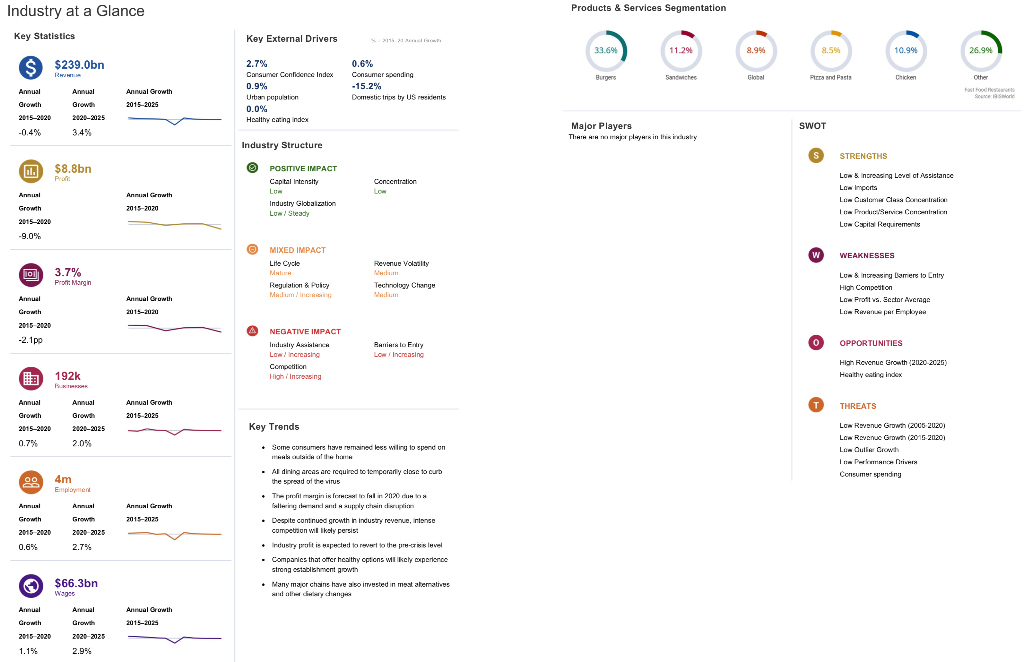
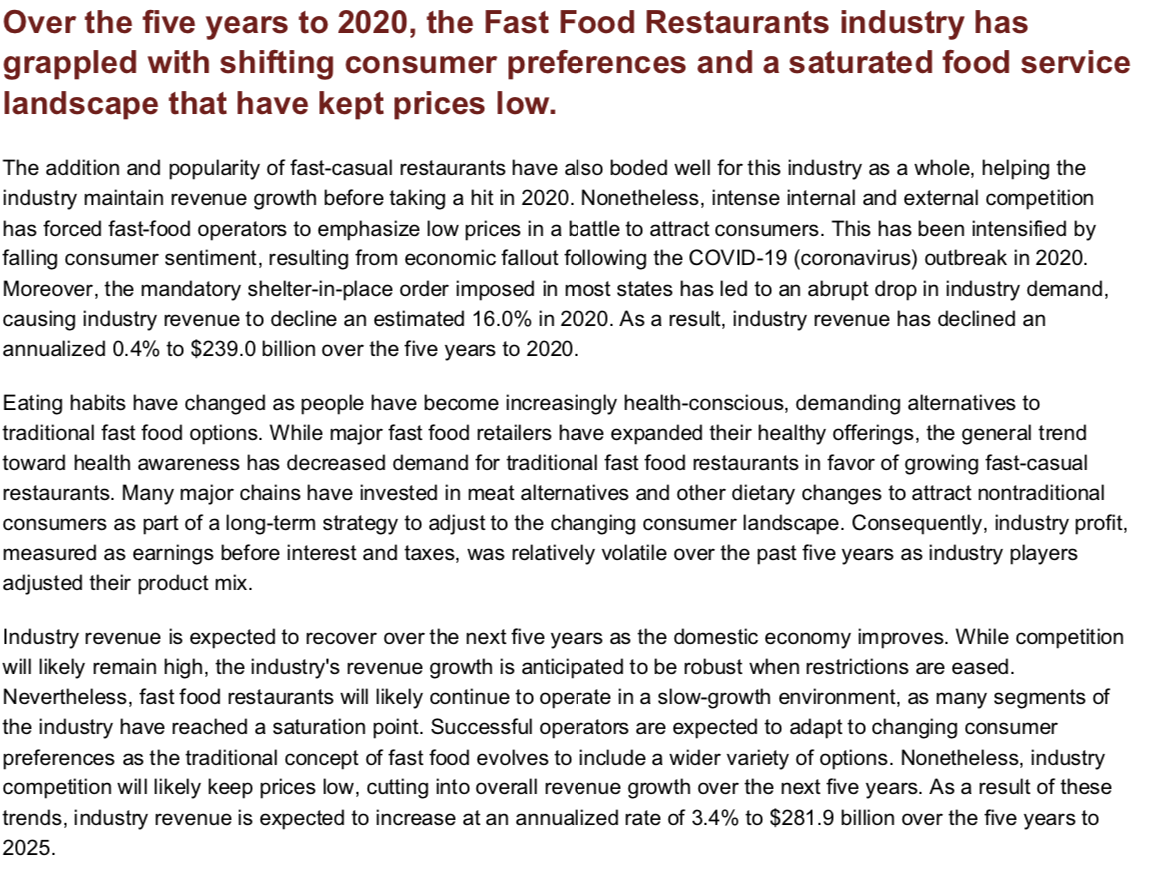
Upon completion of this discussion forum, you should be able to analyze a company's position in the market using the BCG Matrix and assess it's growth strategies using the Ansoff Matrix. Below is a table depicting McDonald's recent market share : Top five fast food brands By global market share McDonald's KFC ISubway 17-Eleven Burger King 15% 12 LILI 9 6 2009 2011 0 2013 Source: Euromonitor Review this IBIS World report to identify the fast food industry's annual growth rate (based on revenue) (Hint: see Industry at a Glance: Key Statistics). Based on the above information regarding McDonald's (consider only the company's performance prior to COVID-19), how would you classify McDonald's based on the growth- share (BCG) matrix (star, question mark, cash cow, or dog)? Justify your classification based on the data provided! Supply Chain About This Industry Industry Definition Thia induatry comprise restaurants where patrons pay for quick-sarvice food products before evine Purchases may to che il like This instalry was kleiner establishments also sal beverages, such a water, ice and socias, but usually not alcohol Key External Drivers Consumer spending Consumer Confidence Index Domestic trips by us residenta Healthy eating index Urban population Major Players ThHHH this industry Main Activities Canamera in the US Animal Food Production in the US Goods & Other Grocery Wholesaling in the US The primary activities of this industry are: Operating quick service restaurants Operating fast food service Operating driver and facilita Frozen Food Production in the US Restaurant & Hotel Equipment Wholesaling in the US Dairy Product Production in the US The major products and services in this industry are Burgers Soda Production in the US Computer & Packaged Software Wholesaling in the US Sandwiches Gimte Bread Production in the Grocery Wholesaling in the US ist Tier Suppliers Fast Food Restaurants in the US Frozen Food Wholesaling in the US 1st Tier Buyers Chicken Baling Mix & Prepared Food Production in the US Dairy Wholesaling in the US Major Household Appliance Manufacturing in the US Egg & Poulins Wholesaling in the US Computer Manufacturing in the us Beef & Pork Wholesaling in the US Confectionery Wholesaling in the US Sugar Processing in the US SIMILAR INDUSTRIES Specialty Food Ssores in the US Chain Restaurants in the US Cars in the US Single Location Full-Service Ruslans in the US Street Vendors in the US Bars & Nighubs in the US RELATED INTERNATIONAL INDUSTRIES Glocal Fast Food Restaurants Fast Food Restaurants in Cina Fast Food and Takeaway Food Services in Austria Frel Food Rex babe in Canal C Takeaway & Fast Food Restaurants in the UK REW THEHAMN Iruland Ry & Ty in the UK Fra Food TRY FOX Series in New Zealand Industry at a Glance Products & Services Segmentation Key Statistics Key External Drivers 33.69 11.294 8.99 8.5% 10.991 26.991 $239.Obn RHIA 0.6% Consumer spending -15.2% Domestic Irig try US rekenis Burgers Global Plera and Pasta Chicken Annual Annual Growth 2.7% Consumer Confidence Index 0.9% Urban population 0.0% Healthy caring index Annual Growth 2020-2025 Growth 2015-2020 2015-2025 SWOT -0.4% Major Players THATHTHAM in the Industry Structure S STRENGTHS $8.8bn PA POSITIVE IMPACT Captal intensity LUM Industry Globalzation Low Steady Concentration LO Annual Annual Growth 2015-2020 Low Increasing Love of Assistance Low Imports Lin rie Clas aintha It Provin Concion Lun Capital Requirements Growth 2015-2020 -9.0% MIXED IMPACT Life Cycle w WEAKNESSES Revenue Volanty 3.7% Prof: Margin Technology Change Regulation & Pulty Madumi Annual Growth 2015 2020 Annual Growth 2015-2020 LUW & intressing Lamers to Entry High Competition Low Proft vector Average Low RPA ERA A -2.100 O OPPORTUNITIES NEGATIVE IMPACT Indusly AmbH Low Increasing Competition High increasing Benito Fry Low Increasing High Revenue Growth 2020 2026 Ha t sull + Ink 192k B. Annual Annual Annual Growth THREATS Growd 2015-2020 Growth 2015-2020 0.7% 2020-2025 Key Trends 2.0% Some consumers are rund us willing to spend un THAL the hari Al dining arcas are required to temporary close to curb the spread of the virus Tre profil mjini celloflin 202) Low Rowane Gown (2006-2020) Low Row (2016-2020 Low Qulier Crowd I PROD Consumer spending 4m Annual Annual rmwth , Annual Growth 2020-2025 Growth 2015 2020 2015-2025 0.69 2.754 Despite continued growth in industry revenue, intense competition will likely persis: + Industry profit is nupected lower to the presive . Companies that offer healthy options will clyperience strong establishment Many major chains have 30 imusted in mest atematies $66.3bn Wages Annual Annual Annual Growth Growth 2015-2025 Growth 2015 2020 1.153 2020-2025 2.995 Over the five years to 2020, the Fast Food Restaurants industry has grappled with shifting consumer preferences and a saturated food service landscape that have kept prices low. The addition and popularity of fast-casual restaurants have also boded well for this industry as a whole, helping the industry maintain revenue growth before taking a hit in 2020. Nonetheless, intense internal and external competition has forced fast-food operators to emphasize low prices in a battle to attract consumers. This has been intensified by falling consumer sentiment, resulting from economic fallout following the COVID-19 (coronavirus) outbreak in 2020. Moreover, the mandatory shelter-in-place order imposed in most states has led to an abrupt drop in industry demand, causing industry revenue to decline an estimated 16.0% in 2020. As a result, industry revenue has declined an annualized 0.4% to $239.0 billion over the five years to 2020. Eating habits have changed as people have become increasingly health-conscious, demanding alternatives to traditional fast food options. While major fast food retailers have expanded their healthy offerings, the general trend toward health awareness has decreased demand traditional fast food taurants in favor growing fast-casual restaurants. Many major chains have invested in meat alternatives and other dietary changes to attract nontraditional consumers as part of a long-term strategy to adjust to the changing consumer landscape. Consequently, industry profit, measured as earnings before interest and taxes, was relatively volatile over the past five years as industry players adjusted their product mix. Industry revenue is expected to recover over the next five years as the domestic economy improves. While competition will likely remain high, the industry's revenue growth is anticipated to be robust when restrictions are eased. Nevertheless, fast food restaurants will likely continue to operate in a slow-growth environment, as many segments of the industry have reached a saturation point. Successful operators are expected to adapt to changing consumer preferences as the traditional concept of fast food evolves to include a wider variety of options. Nonetheless, industry competition will likely keep prices low, cutting into overall revenue growth over the next five years. As a result of these trends, industry revenue is expected to increase at an annualized rate of 3.4% to $281.9 billion over the five years to 2025


