

Question: Based on the analysis using the data provided for the project, the Treynor's measure for the market portfolio to be To help you answer this
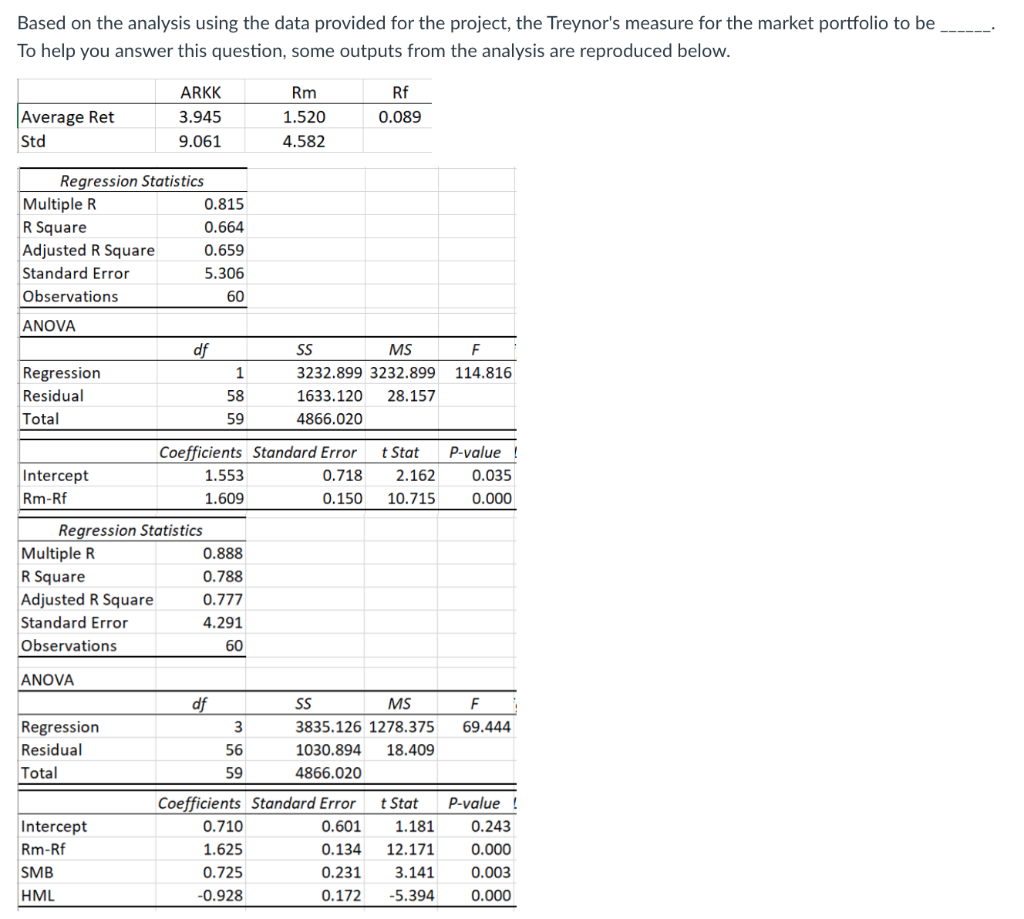
Based on the analysis using the data provided for the project, the Treynor's measure for the market portfolio to be To help you answer this question, some outputs from the analysis are reproduced below. ARKK 3.945 9.061 Average Ret Std Rm 1.520 4.582 Rf 0.089 Regression Statistics Multiple R 0.815 R Square 0.664 Adjusted R Square 0.659 Standard Error 5.306 Observations 60 ANOVA df F 114.816 1 Regression Residual Total SS MS 3232.899 3232.899 1633.120 28.157 4866.020 58 59 Coefficients Standard Error 1.553 0.718 1.609 0.150 t Stat 2.162 Intercept Rm-Rf P-value ! 0.035 0.000 10.715 Regression Statistics Multiple R 0.888 R Square 0.788 Adjusted R Square 0.777 Standard Error 4.291 Observations 60 ANOVA df F 3 69.444 Regression Residual Total SS MS 3835.126 1278.375 1030.894 18.409 4866.020 56 59 Intercept Rm-Rf SMB HML Coefficients Standard Error 0.710 0.601 1.625 0.134 0.725 0.231 -0.928 0.172 t Stat 1.181 12.171 3.141 -5.394 P-value ! 0.243 0.000 0.003 0.000 Based on the analysis using the data provided for the project, the Treynor's measure for the market portfolio to be To help you answer this question, some outputs from the analysis are reproduced below. ARKK 3.945 9.061 Average Ret Std Rm 1.520 4.582 Rf 0.089 Regression Statistics Multiple R 0.815 R Square 0.664 Adjusted R Square 0.659 Standard Error 5.306 Observations 60 ANOVA df F 114.816 1 Regression Residual Total SS MS 3232.899 3232.899 1633.120 28.157 4866.020 58 59 Coefficients Standard Error 1.553 0.718 1.609 0.150 t Stat 2.162 Intercept Rm-Rf P-value ! 0.035 0.000 10.715 Regression Statistics Multiple R 0.888 R Square 0.788 Adjusted R Square 0.777 Standard Error 4.291 Observations 60 ANOVA df F 3 69.444 Regression Residual Total SS MS 3835.126 1278.375 1030.894 18.409 4866.020 56 59 Intercept Rm-Rf SMB HML Coefficients Standard Error 0.710 0.601 1.625 0.134 0.725 0.231 -0.928 0.172 t Stat 1.181 12.171 3.141 -5.394 P-value ! 0.243 0.000 0.003 0.000
Step by Step Solution
There are 3 Steps involved in it

Get step-by-step solutions from verified subject matter experts