

Question: Based on the analysis using the data provided for the project, the Treynor's measure for the market portfolio to be ---- To help you answer
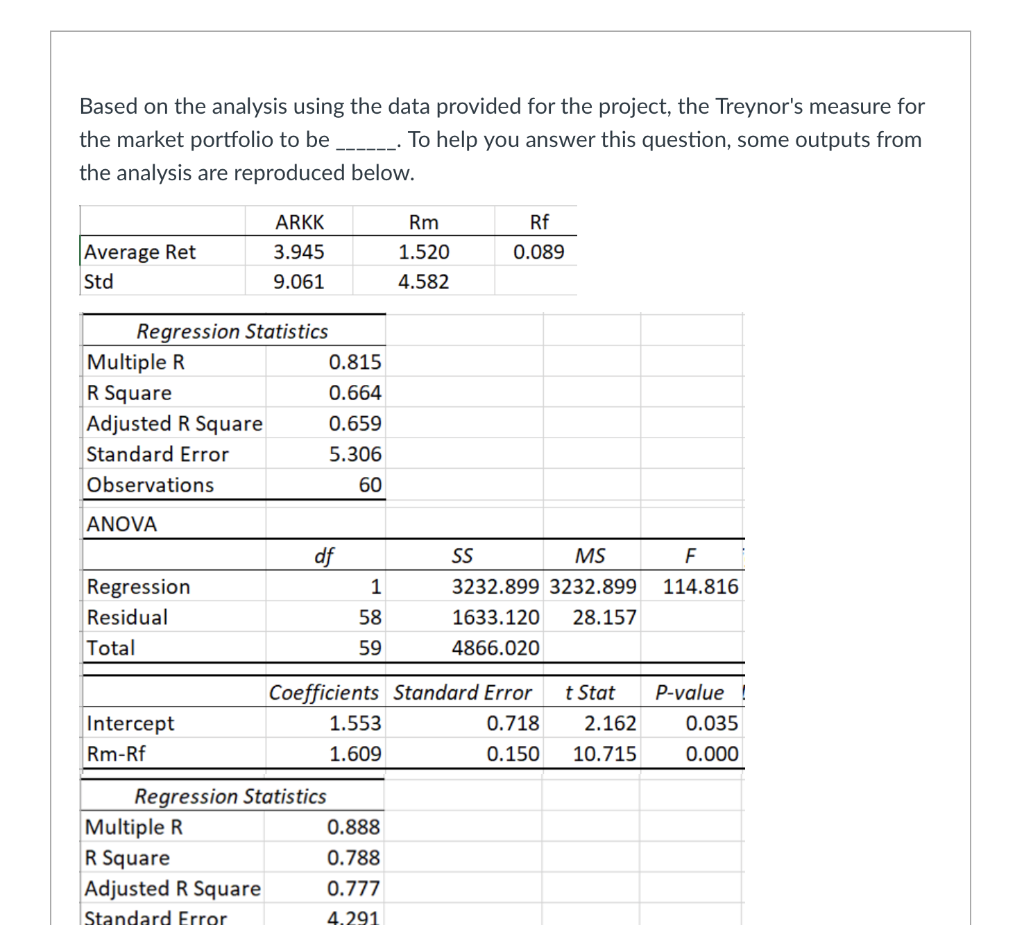
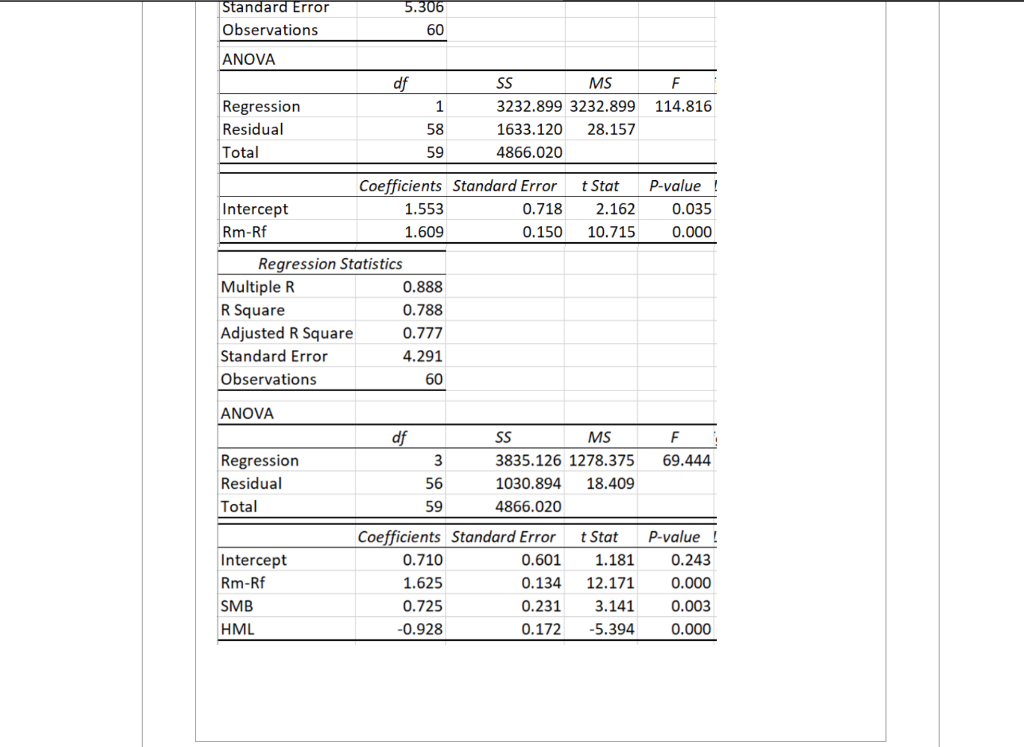
Based on the analysis using the data provided for the project, the Treynor's measure for the market portfolio to be ---- To help you answer this question, some outputs from the analysis are reproduced below. ARKK 3.945 9.061 Average Ret Rm 1.520 4.582 Rf 0.089 Std Regression Statistics Multiple R 0.815 R Square 0.664 Adjusted R Square 0.659 Standard Error 5.306 Observations 60 ANOVA df F 1 114.816 Regression Residual Total SS MS 3232.899 3232.899 1633.120 28.157 4866.020 58 59 Intercept Rm-Rf Coefficients Standard Error 1.553 0.718 1.609 0.150 t Stat 2.162 10.715 P-value ! 0.035 0.000 Regression Statistics Multiple R 0.888 R Square 0.788 Adjusted R Square 0.777 Standard Error 4.291 Standard Error Observations 5.306 60 ANOVA df F 114.816 Regression Residual Total 1 58 59 SS MS 3232.899 3232.899 1633.120 28.157 4866.020 t Stat 2.162 10.715 P-value ! 0.035 0.000 Rm-Rf Coefficients Standard Error Intercept 1.553 0.718 1.609 0.150 Regression Statistics Multiple R 0.888 R Square 0.788 Adjusted R Square 0.777 Standard Error 4.291 Observations 60 ANOVA F 69.444 Regression Residual Total df SS MS 3 3835.126 1278.375 56 1030.894 18.409 59 4866.020 Coefficients Standard Error t Stat 0.710 0.601 1.181 1.625 0.134 12.171 0.725 0.231 3.141 -0.928 -5.394 P-value ! 0.243 Intercept Rm-Rf SMB HML 0.000 0.003 0.000 0.172 Based on the analysis using the data provided for the project, the Treynor's measure for the market portfolio to be ---- To help you answer this question, some outputs from the analysis are reproduced below. ARKK 3.945 9.061 Average Ret Rm 1.520 4.582 Rf 0.089 Std Regression Statistics Multiple R 0.815 R Square 0.664 Adjusted R Square 0.659 Standard Error 5.306 Observations 60 ANOVA df F 1 114.816 Regression Residual Total SS MS 3232.899 3232.899 1633.120 28.157 4866.020 58 59 Intercept Rm-Rf Coefficients Standard Error 1.553 0.718 1.609 0.150 t Stat 2.162 10.715 P-value ! 0.035 0.000 Regression Statistics Multiple R 0.888 R Square 0.788 Adjusted R Square 0.777 Standard Error 4.291 Standard Error Observations 5.306 60 ANOVA df F 114.816 Regression Residual Total 1 58 59 SS MS 3232.899 3232.899 1633.120 28.157 4866.020 t Stat 2.162 10.715 P-value ! 0.035 0.000 Rm-Rf Coefficients Standard Error Intercept 1.553 0.718 1.609 0.150 Regression Statistics Multiple R 0.888 R Square 0.788 Adjusted R Square 0.777 Standard Error 4.291 Observations 60 ANOVA F 69.444 Regression Residual Total df SS MS 3 3835.126 1278.375 56 1030.894 18.409 59 4866.020 Coefficients Standard Error t Stat 0.710 0.601 1.181 1.625 0.134 12.171 0.725 0.231 3.141 -0.928 -5.394 P-value ! 0.243 Intercept Rm-Rf SMB HML 0.000 0.003 0.000 0.172
Step by Step Solution
There are 3 Steps involved in it

Get step-by-step solutions from verified subject matter experts