

Question: Based on the boxplot above, identify the 5 number summary (min, Q1, median, Q3, max) _____ , _____ , _____ , ____ , _____ The
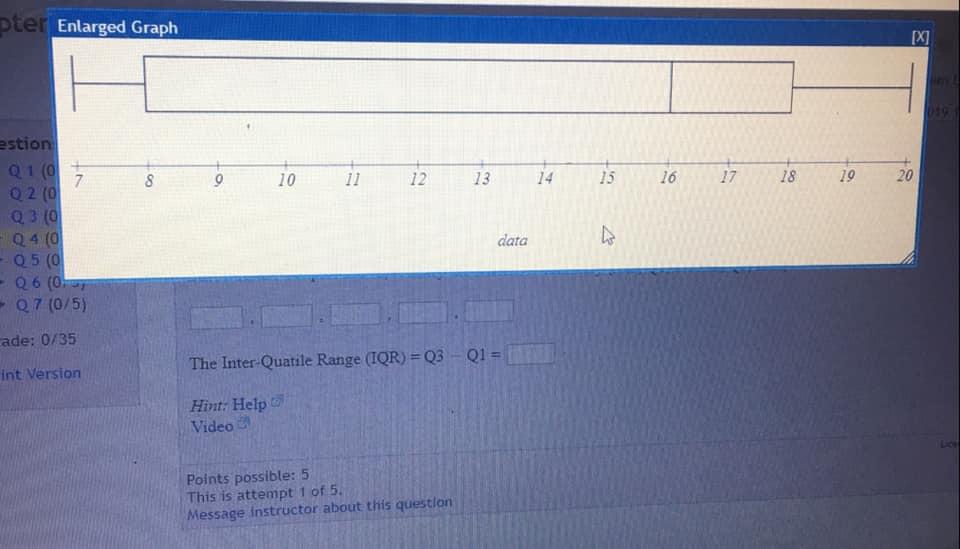
Based on the boxplot above, identify the 5 number summary (min, Q1, median, Q3, max)
_____ , _____ , _____ , ____ , _____
The Inter-Quartile Range (IQR) = Q3?-Q1 =
pter Enlarged Graph estion Q1 (0 Q2 (0) Q3 (0 Q4 (0) Q5 (0 7 Q6 (07 Q7 (0/5) ade: 0/35 int Version 8 10 11 12 13 Points possible: 5 This is attempt 1 of 5. Message Instructor about this question data The Inter-Quatile Range (IQR) = Q3 - Q1 = Hint: Help Video 5 14 15 4 16 17 18 19 [X] 20 019 ) Lice
Step by Step Solution
★★★★★
3.44 Rating (151 Votes )
There are 3 Steps involved in it
1 Expert Approved Answer
Step: 1 Unlock

From given box plot The 5 ... View full answer
Question Has Been Solved by an Expert!
Get step-by-step solutions from verified subject matter experts
Step: 2 Unlock
Step: 3 Unlock