

Question: Based on the BSG game. The higlighted sections in bleu shoold be modified to make it favorable for the company. It's a footwear company. PROJECTED
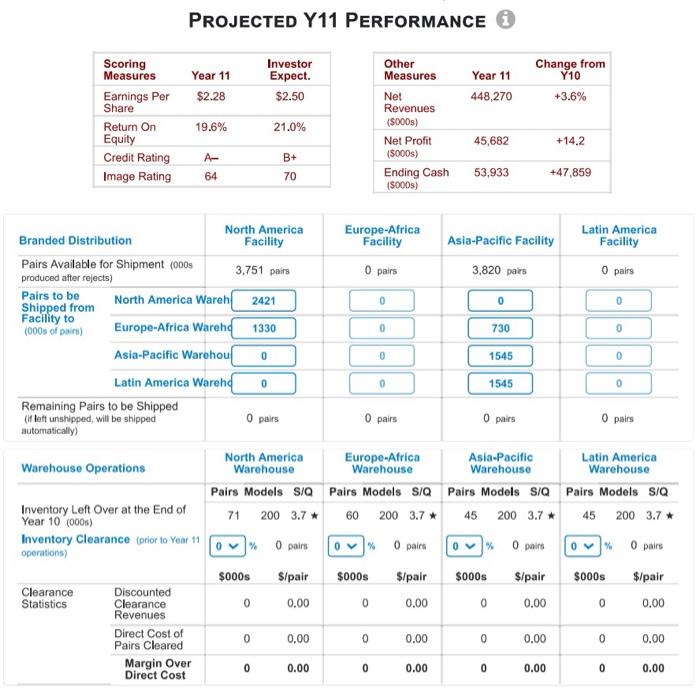
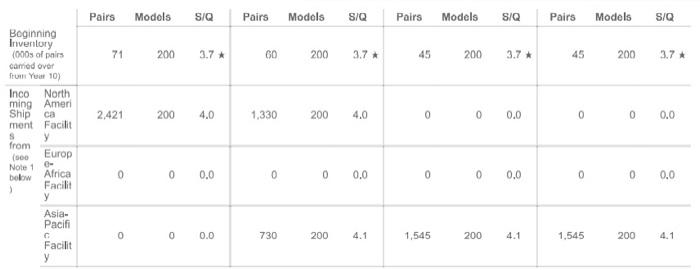
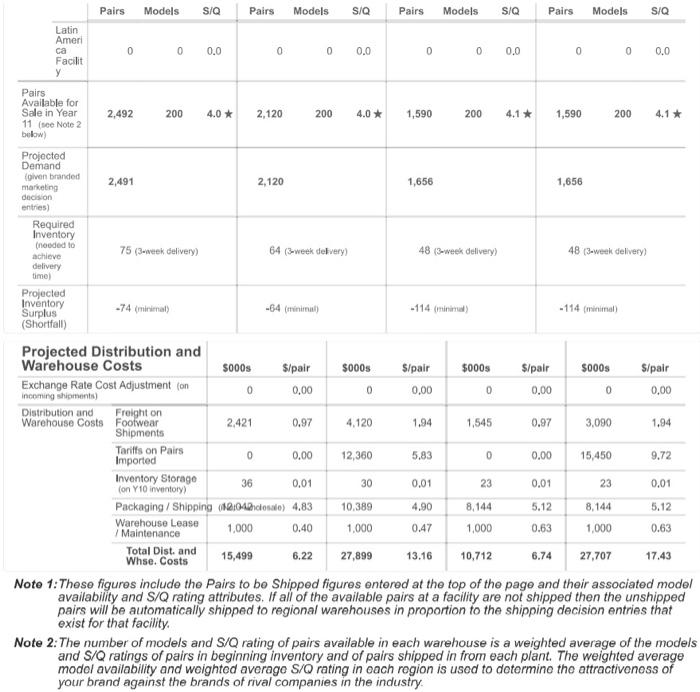
PROJECTED Y11 PERFORMANCE O Year 11 $2.28 Investor Expect. $2.50 Year 11 448,270 Change from Y10 +3.6% Scoring Measures Earnings Per Share Return On Equity Credit Rating Image Rating 19.6% 21.0% Other Measures Net Revenues (5000s) Net Profit (5000s) Ending Cash (5000) 45,682 +14.2 A- 64 B+ 70 53,933 +47,859 Europe-Africa Facility Latin America Facility Asia-Pacific Facility 3,820 pairs O pairs O pairs 0 0 0 1330 730 0 0 0 1545 0 0 0 1545 0 O pairs O pairs O pairs O pairs North America Branded Distribution Facility Pairs Available for Shipment (000s produced after rejects) 3,751 pairs Pairs to be North America Waren 2421 Shipped from Facility to (000s of point) Europe-Africa Warend Asia-Pacific Warehou Latin America Warend Remaining Pairs to be shipped (if left unshipped, will be shipped automatically) North America Warehouse Operations Warehouse Pairs Models S/Q Inventory Left Over at the End of Year 10 000) 71 200 3.7* Inventory Clearance (prior to Year 110v O pairs operations $000s S/pair Clearance Discounted Statistics Clearance 0 0.00 Revenues Direct Cost of 0 0.00 Pairs Cleared Margin Over 0.00 Direct Cost Europe-Africa Asia-Pacific Latin America Warehouse Warehouse Warehouse Pairs Models S/Q Pairs Models S/Q Pairs Models S/Q 60 200 3.7* 45 200 3.7* 45 200 3.7* 0 % 0 pairs 0 % O pairs 0 % O pairs $000s S/pair $000s $/pair $000s $/pair 0 0.00 0 0.00 0 0.00 0 0.00 0 0.00 0 0.00 0 0 0.00 0 0.00 0 0.00 Pairs Models SIQ Pairs Models S/Q Pairs Models SIQ Pairs Models S/Q 71 200 3.7* 00 200 3.7* 45 200 3.7* 45 200 3.7 Boginning Inventory (000s of pairs comed over from You! 10) Inco North ming Ameri Ship ca ment Facilit S y from (500 Europ Note 1 0- 2,421 200 4.0 1,330 200 4.0 0 0 0.0 0 0 0.0 below Africa 0 0 0.0 0 0 0.0 0 0 0 0.0 0 0 0.0 ) Facilit y Asia- Pacifi 0 0 0 0.0 730 200 4.1 1,545 200 4.1 1,545 200 4.1 Facilit y Pairs Models S/Q Pairs Models SIQ Pairs Models S/Q Pairs Models S/Q 0 0 0.0 0 0 0.0 0 0 0.0 0 0 0.0 Latin Ameri Facilit Pairs Available for Sale in Year 11 (nee Note 2 below) 2,492 200 4.0 * 2,120 200 4.0 * 1,590 200 4.1* 1,590 200 4.1* Projected Demand (given branded 2,491 2,120 marketing 1,656 1,656 decision entries) Required Inventory needed to 75 (3week delivery) 64 (3-week delvery) achieve 48 (3-week delivery) 48 (3-week delivery) delivery timel Projected Inventory -74 (inimal -64 (minimal Surplus - 114 mi) (Shortfall) Projected Distribution and Warehouse Costs 5000s $/pair $000s S/pair $000s $/pair 5000s S/pair Exchange Rate Cost Adjustment on 0 0,00 0 0.00 0 0.00 0 0.00 Incoming shipments) Distribution and Freighton Warehouse Costs Footwear 2,421 0.97 4.120 1.545 0.97 3,090 1.94 Shipments Tariffs on Pairs 0 0.00 12,360 5.83 0 0.00 15,450 Imported 9.72 Inventory Storage 36 0.01 30 0.01 23 0.01 23 0.01 (on Y10 inventory) Packaging / Shipping (2:04bcional) 4.83 10.389 4.90 8,144 5.12 8,144 5.12 Warehouse Lease Maintenance 1,000 0.40 1,000 0.47 1,000 0.63 1,000 0.63 Total Dist. and 15,499 Whse. Costs 27,899 13.16 10,712 6.74 27,707 17.43 Note 1: These figures include the Pairs to be shipped figures entered at the top of the page and their associated model availability and S/Q rating attributes. If all of the available pairs at a facility are not shipped then the unshipped pairs will be automatically shipped to regional warehouses in proportion to the shipping decision entries that exist for that facility. Note 2: The number of models and S/Q rating of pairs available in each warehouse is a weighted average of the models and S/Q ratings of pairs in beginning inventory and of pairs shipped in from each plant. The weighted average modol availability and weighted average S/Q rating in cach region is used to determine the attractivonoss of your brand against the brands of rival companies in the industry 1.94 6.22 PROJECTED Y11 PERFORMANCE O Year 11 $2.28 Investor Expect. $2.50 Year 11 448,270 Change from Y10 +3.6% Scoring Measures Earnings Per Share Return On Equity Credit Rating Image Rating 19.6% 21.0% Other Measures Net Revenues (5000s) Net Profit (5000s) Ending Cash (5000) 45,682 +14.2 A- 64 B+ 70 53,933 +47,859 Europe-Africa Facility Latin America Facility Asia-Pacific Facility 3,820 pairs O pairs O pairs 0 0 0 1330 730 0 0 0 1545 0 0 0 1545 0 O pairs O pairs O pairs O pairs North America Branded Distribution Facility Pairs Available for Shipment (000s produced after rejects) 3,751 pairs Pairs to be North America Waren 2421 Shipped from Facility to (000s of point) Europe-Africa Warend Asia-Pacific Warehou Latin America Warend Remaining Pairs to be shipped (if left unshipped, will be shipped automatically) North America Warehouse Operations Warehouse Pairs Models S/Q Inventory Left Over at the End of Year 10 000) 71 200 3.7* Inventory Clearance (prior to Year 110v O pairs operations $000s S/pair Clearance Discounted Statistics Clearance 0 0.00 Revenues Direct Cost of 0 0.00 Pairs Cleared Margin Over 0.00 Direct Cost Europe-Africa Asia-Pacific Latin America Warehouse Warehouse Warehouse Pairs Models S/Q Pairs Models S/Q Pairs Models S/Q 60 200 3.7* 45 200 3.7* 45 200 3.7* 0 % 0 pairs 0 % O pairs 0 % O pairs $000s S/pair $000s $/pair $000s $/pair 0 0.00 0 0.00 0 0.00 0 0.00 0 0.00 0 0.00 0 0 0.00 0 0.00 0 0.00 Pairs Models SIQ Pairs Models S/Q Pairs Models SIQ Pairs Models S/Q 71 200 3.7* 00 200 3.7* 45 200 3.7* 45 200 3.7 Boginning Inventory (000s of pairs comed over from You! 10) Inco North ming Ameri Ship ca ment Facilit S y from (500 Europ Note 1 0- 2,421 200 4.0 1,330 200 4.0 0 0 0.0 0 0 0.0 below Africa 0 0 0.0 0 0 0.0 0 0 0 0.0 0 0 0.0 ) Facilit y Asia- Pacifi 0 0 0 0.0 730 200 4.1 1,545 200 4.1 1,545 200 4.1 Facilit y Pairs Models S/Q Pairs Models SIQ Pairs Models S/Q Pairs Models S/Q 0 0 0.0 0 0 0.0 0 0 0.0 0 0 0.0 Latin Ameri Facilit Pairs Available for Sale in Year 11 (nee Note 2 below) 2,492 200 4.0 * 2,120 200 4.0 * 1,590 200 4.1* 1,590 200 4.1* Projected Demand (given branded 2,491 2,120 marketing 1,656 1,656 decision entries) Required Inventory needed to 75 (3week delivery) 64 (3-week delvery) achieve 48 (3-week delivery) 48 (3-week delivery) delivery timel Projected Inventory -74 (inimal -64 (minimal Surplus - 114 mi) (Shortfall) Projected Distribution and Warehouse Costs 5000s $/pair $000s S/pair $000s $/pair 5000s S/pair Exchange Rate Cost Adjustment on 0 0,00 0 0.00 0 0.00 0 0.00 Incoming shipments) Distribution and Freighton Warehouse Costs Footwear 2,421 0.97 4.120 1.545 0.97 3,090 1.94 Shipments Tariffs on Pairs 0 0.00 12,360 5.83 0 0.00 15,450 Imported 9.72 Inventory Storage 36 0.01 30 0.01 23 0.01 23 0.01 (on Y10 inventory) Packaging / Shipping (2:04bcional) 4.83 10.389 4.90 8,144 5.12 8,144 5.12 Warehouse Lease Maintenance 1,000 0.40 1,000 0.47 1,000 0.63 1,000 0.63 Total Dist. and 15,499 Whse. Costs 27,899 13.16 10,712 6.74 27,707 17.43 Note 1: These figures include the Pairs to be shipped figures entered at the top of the page and their associated model availability and S/Q rating attributes. If all of the available pairs at a facility are not shipped then the unshipped pairs will be automatically shipped to regional warehouses in proportion to the shipping decision entries that exist for that facility. Note 2: The number of models and S/Q rating of pairs available in each warehouse is a weighted average of the models and S/Q ratings of pairs in beginning inventory and of pairs shipped in from each plant. The weighted average modol availability and weighted average S/Q rating in cach region is used to determine the attractivonoss of your brand against the brands of rival companies in the industry 1.94 6.22
Step by Step Solution
There are 3 Steps involved in it

Get step-by-step solutions from verified subject matter experts