

Question: Based on the control chart shown below, the process is Samble VS Number of defect control chart table [ [ Number of defects Limit
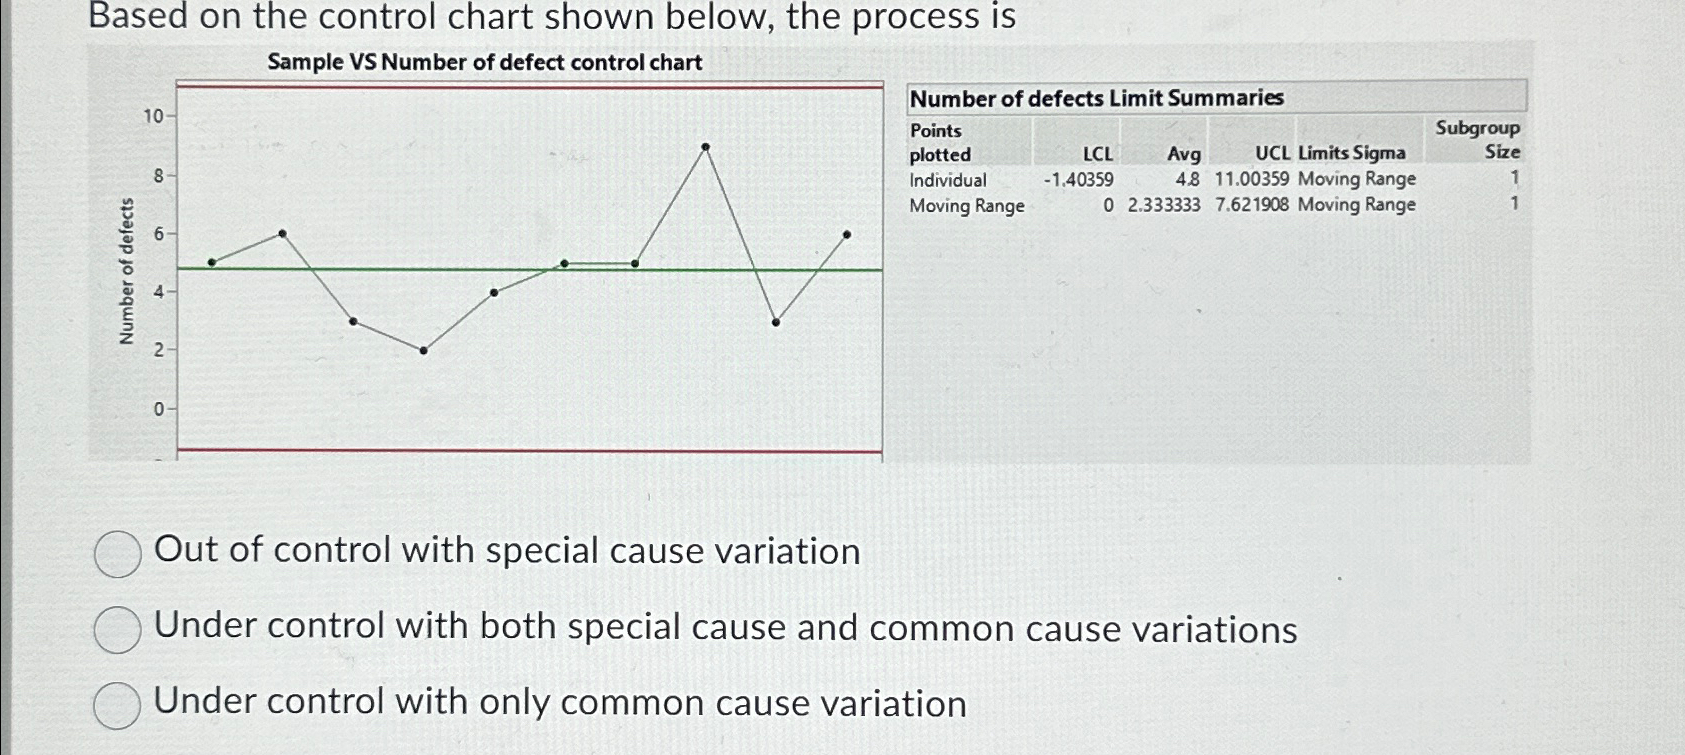
Based on the control chart shown below, the process is
Samble VS Number of defect control chart
tableNumber of defects Limit SummariestablePointsplottedLCLAvg,UCL Limits Sigma,tableSubgroupSizeIndividual Moving Range,Moving Range, Moving Range,
Out of control with special cause variation
Under control with both special cause and common cause variations
Under control with only common cause variation
Step by Step Solution
There are 3 Steps involved in it
1 Expert Approved Answer
Step: 1 Unlock

Question Has Been Solved by an Expert!
Get step-by-step solutions from verified subject matter experts
Step: 2 Unlock
Step: 3 Unlock