

Question: based on the data below what is the slope? E(J) 9.94E-19 6.63E-19 4.97E-19 3.98E-19 3.31E-19 2.84E-19 2.48E-19 2.21E-19 1.99E-19 (nm) 200 300 400 500 600
based on the data below what is the slope?
E(J)
9.94E-19 6.63E-19 4.97E-19 3.98E-19 3.31E-19 2.84E-19 2.48E-19 2.21E-19 1.99E-19
| (nm) |
200 300 400 500 600 700 800 900 1E3
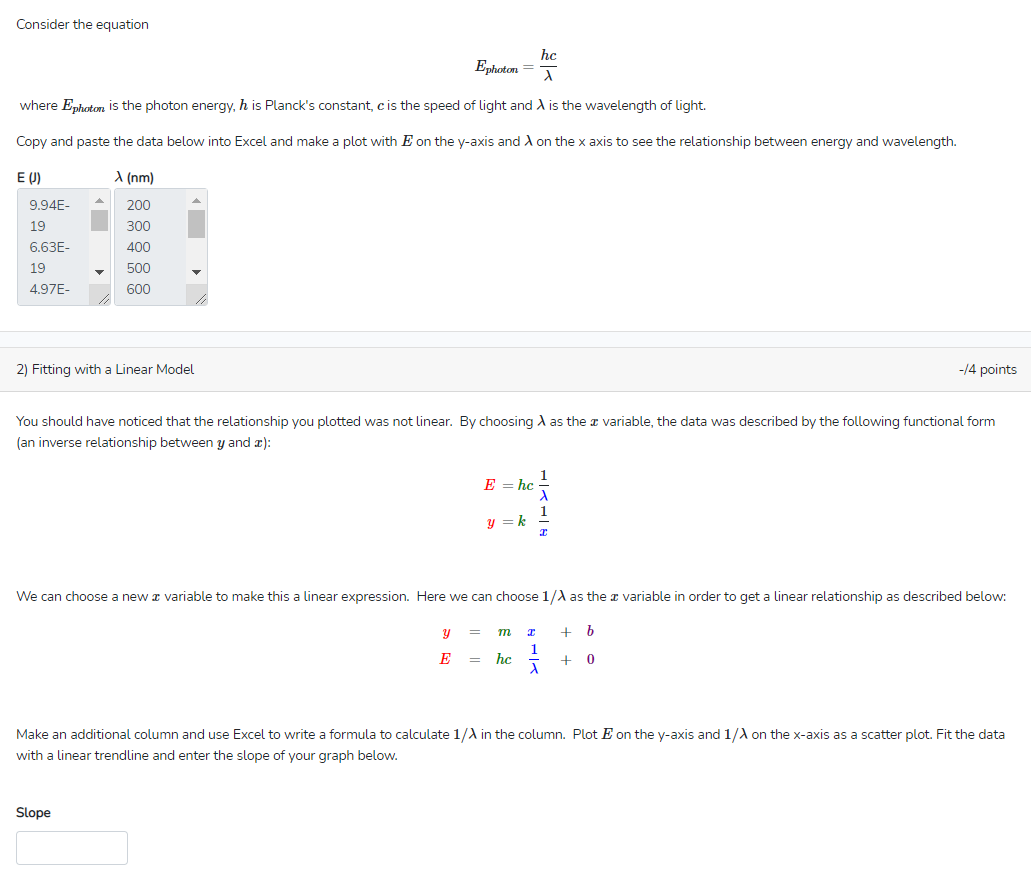
Consider the equation hc Ephoton = T where Ephoton is the photon energy, h is Planck's constant, cis the speed of light and is the wavelength of light. Copy and paste the data below into Excel and make a plot with E on the y-axis and on the x axis to see the relationship between energy and wavelength. E ) (nm) 9.94E- 19 6.63E- 200 300 400 500 600 19 4.97E- 2) Fitting with a Linear Model -/4 points You should have noticed that the relationship you plotted was not linear. By choosing as the variable, the data was described by the following functional form (an inverse relationship between y and c): 1 E = hc 1 y = We can choose a new I variable to make this a linear expression. Here we can choose 1/2 as the I variable in order to get a linear relationship as described below: y = T + h 1 E hc + 0 Make an additional column and use Excel to write a formula to calculate 1/1 in the column. Plot E on the y-axis and 1/1 on the x-axis as a scatter plot. Fit the data with a linear trendline and enter the slope of your graph below. Slope
Step by Step Solution
There are 3 Steps involved in it

Get step-by-step solutions from verified subject matter experts