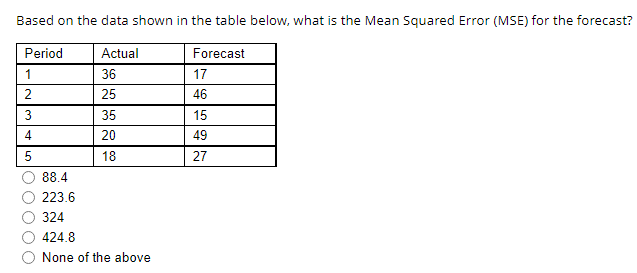
Question: Based on the data shown in the table below, what is the Mean Squared Error (MSE) for the forecast? Forecast 17 46 15 49 Period

Based on the data shown in the table below, whatBased on the data shown in the table below, what

Based on the data shown in the table below, what is the Mean Squared Error (MSE) for the forecast? Forecast 17 46 15 49 Period Actual 1 36 2 25 3 35 4 20 18 88.4 223.6 324 424.8 None of the above 6 27 OOO Given the following historical data and weights of 0.6 for the most recent period, 0.3 for two periods before, and 0.1 for three periods before, what is the weighted three-period moving average forecast for period 5? * ||| Period Value 1 420 2 522 592 570 O 581 O 571.8 O 561.3 0 553.8 O None of the above

Step by Step Solution

There are 3 Steps involved in it

1 Expert Approved Answer
Step: 1 Unlock blur-text-image
Question Has Been Solved by an Expert!

Get step-by-step solutions from verified subject matter experts

Step: 2 Unlock
Step: 3 Unlock

Students Have Also Explored These Related General Management Questions!