

Question: Based on the following X - bar Chart for the 1 st 1 0 days of Monitoring a bagging process for 1 0 ounce bags
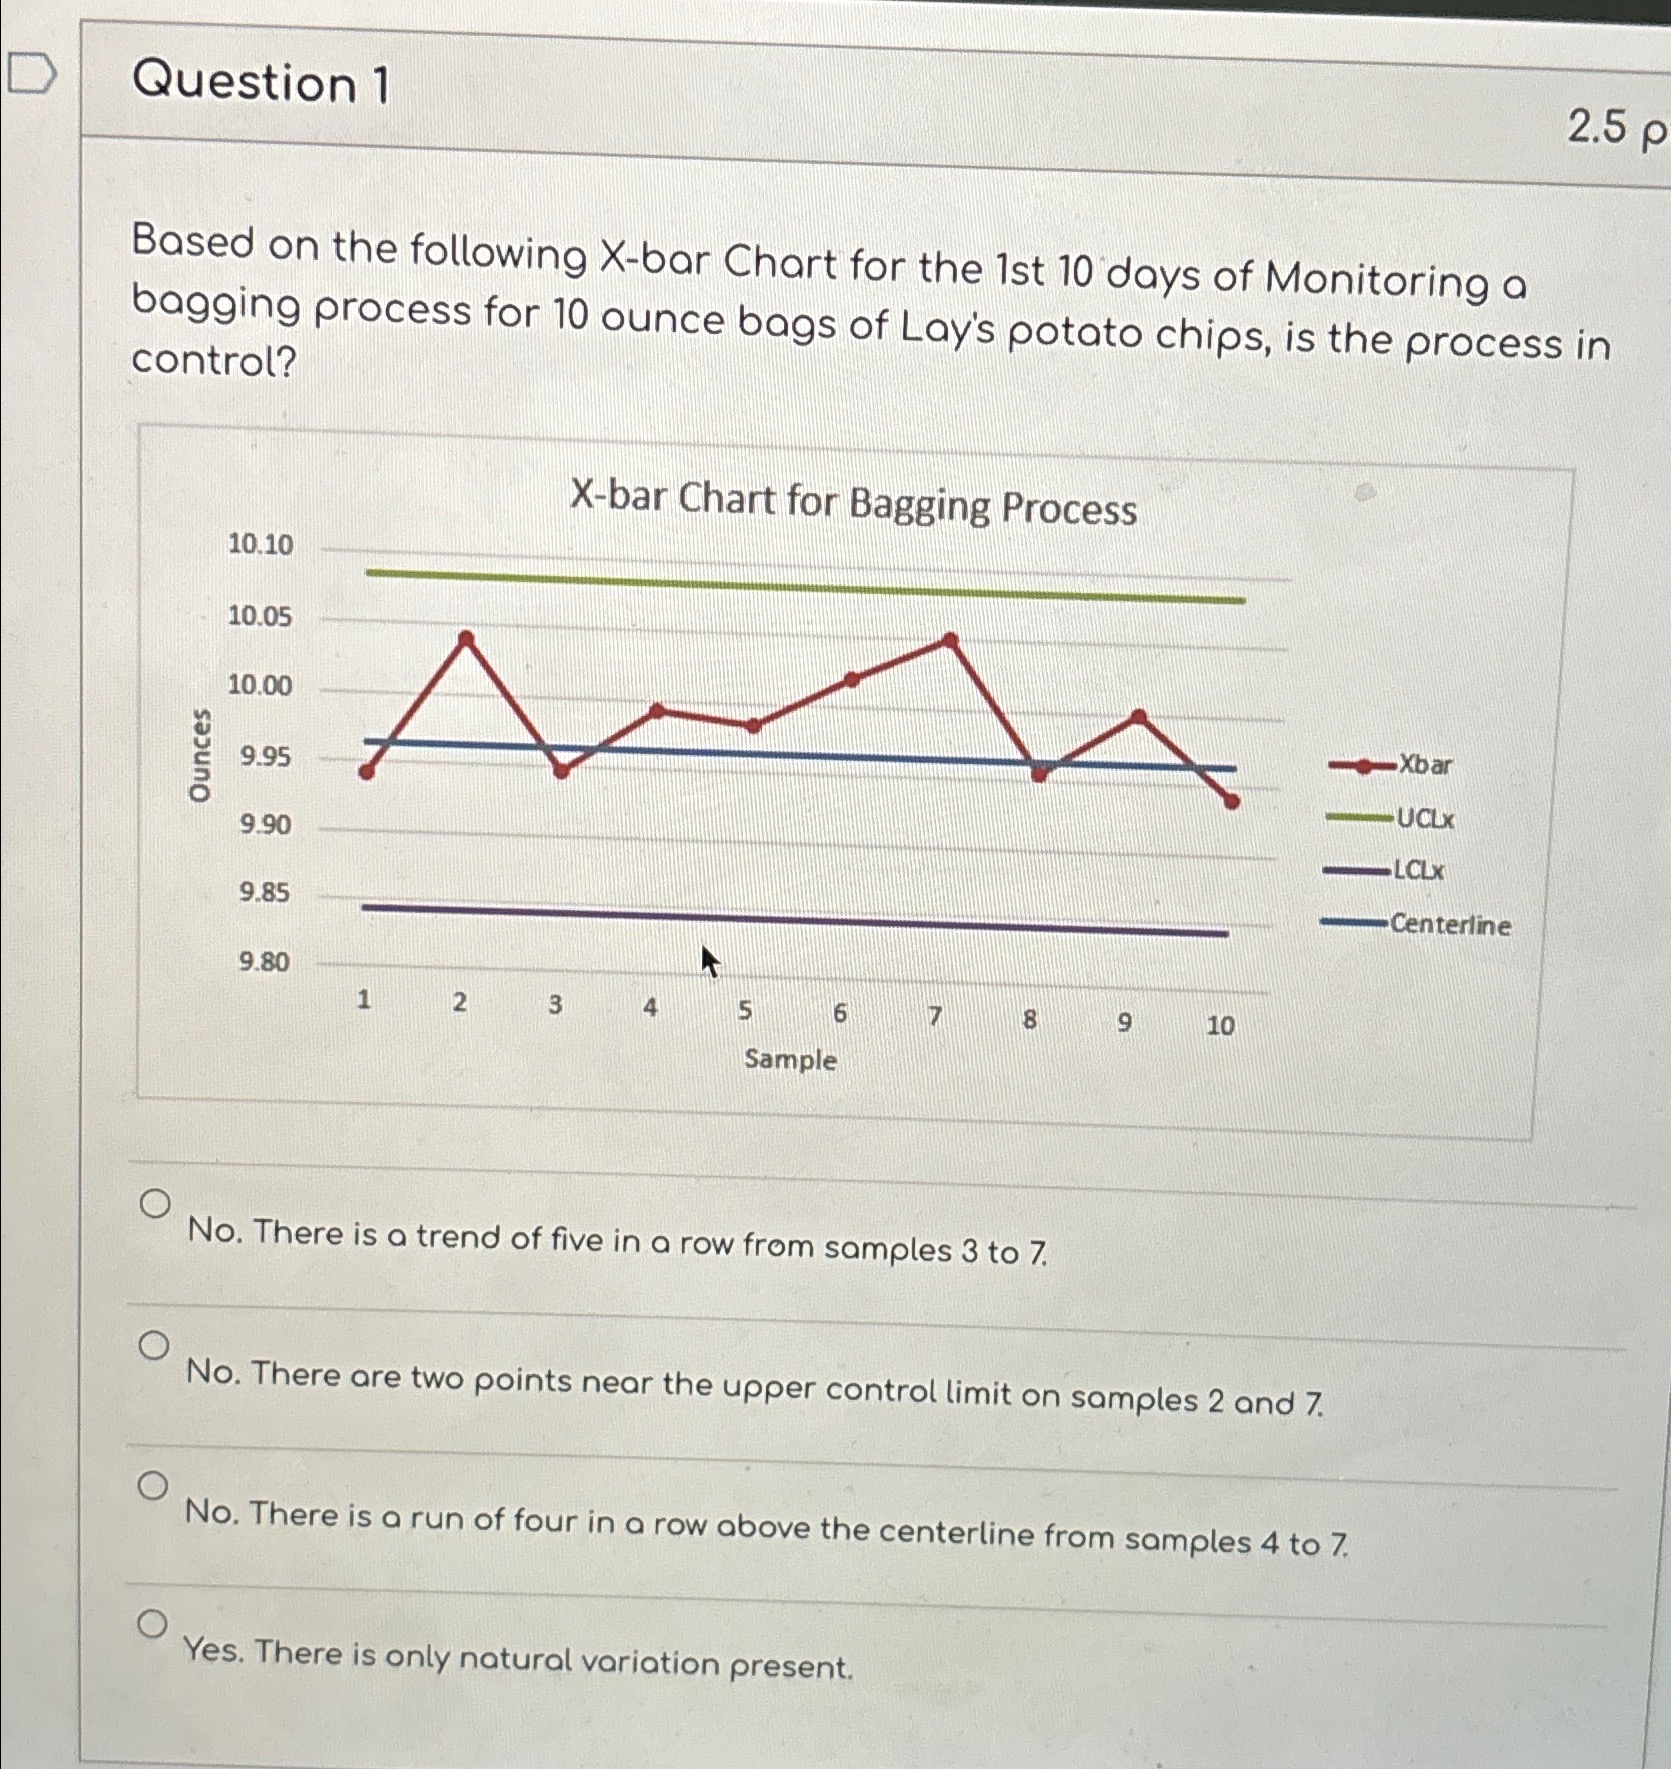
Based on the following Xbar Chart for the st days of Monitoring a bagging process for ounce bags of Lay's potato chips, is the process in control? Xbar Chart for Bagging Process samples Group of answer choices No There is a trend of five in a row from samples to No There are two points near the upper control limit on samples and No There is a run of four in a row above the centerline from samples to Yes. There is only natural variation present.
Question
Based on the following Xbar Chart for the st days of Monitoring a bagging process for ounce bags of Lay's potato chips, is the process in control?
No There is a trend of five in a row from samples to
No There are two points near the upper control limit on samples and
No There is a run of four in a row above the centerline from samples to
Yes. There is only natur
Step by Step Solution
There are 3 Steps involved in it
1 Expert Approved Answer
Step: 1 Unlock

Question Has Been Solved by an Expert!
Get step-by-step solutions from verified subject matter experts
Step: 2 Unlock
Step: 3 Unlock