

Question: Based on the graph, explain how we can see the tradeoff between risk and return and identify which stock you would prefer to combine with
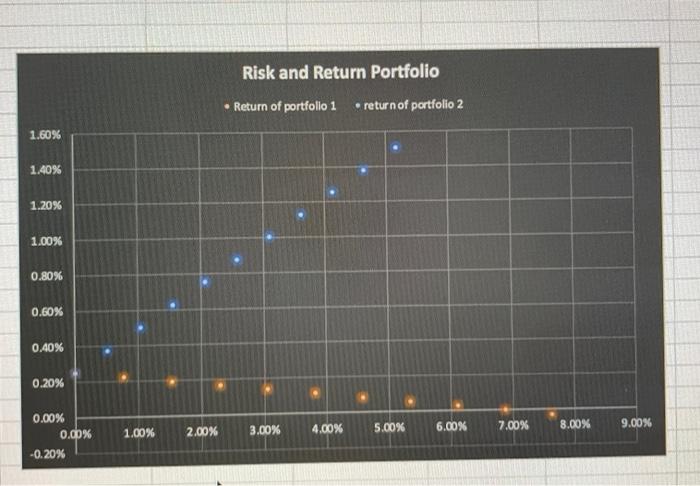
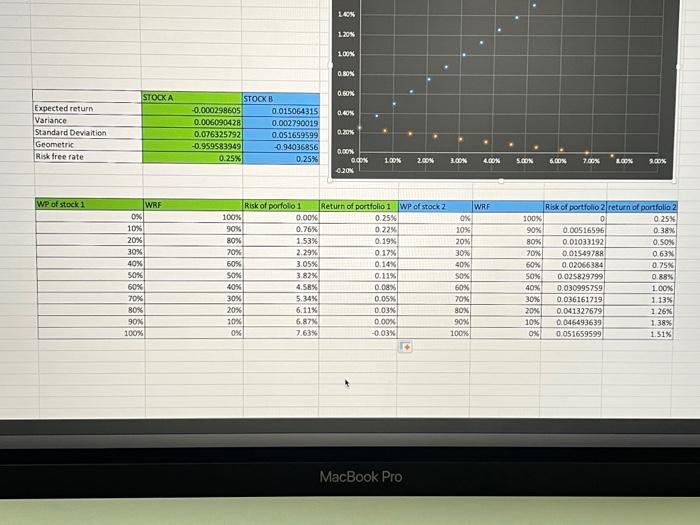
Risk and Return Portfolio Return of portfolio 1 return of portfolio 2 1.60% 1.40% 1.20% 1.00% 0.80% 0.60% 0.40% 0,20% 5.00% 3.00% 4.00% 6.00% 2.00% 9.00% 2.00% 8.00% 0.00% 0.00% -0.20% 1.00% L 40% 1203 100% 0.00% 0.60% STOCKA 0.00 Expected return Variance Standard Deviation Geometric Risk free rate STOCKB -0.000298605 0.015064315 0.006090428 0.002790019 0.076325792 0.051699599 -0.959583949 -0.94036856 0.25% 0.20 0.25% 0.00N Q.COM 0.20 LOON 2.00% 3.00 4.00K SOON 600X 7.00% LOOK 9.00% WP of stock 1 WRE 0% 10% 20% 30% 40% 50% Risk of porfolio 1 Return of portfolio 1 WP of stock 2 100% 0.00% 0.25% 90% 0.76% 0.22% 80% 1.53% 0.19% 70% 2.29% 0.17% 60% 3.05% 0.14% SOX 3.82% 0.11% 40% 4.58% 0.08% 30% 5.34% 0.05% 20% 6.11% 0.03% 10% 6.87% 0.00% 0% 7.63% -0.03% WRF OX 10% 20% 30% 40% SOX 60% 70% 80% 90% 100% 100% 90% 80% 70% 60% SOX 40% 30% 20% 10% 0% Risk of portfolio 2 return of portfolio 2 0 0.25% 0.00516596 0.38% 0.01033192 0.50% 0.01549788 0.63N 0.02066384 0.75% 0.025829799 0.88% 0.030995759 1.00N 0.036161719 1.13% 0 041327679 1 26% 0.046493639 0.051659599 1.51% 60% 70 80% 90% 100% 13 MacBook Pro
Step by Step Solution
There are 3 Steps involved in it

Get step-by-step solutions from verified subject matter experts