

Question: 24. a. b. C. d. Based on the graph, which statement BEST describes aging trends in the United States? 40% 30% 20% 10% 0%
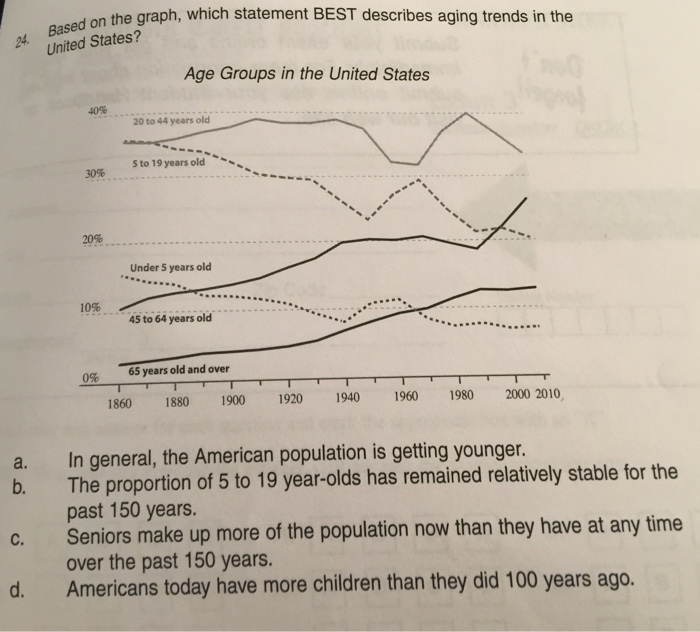
24. a. b. C. d. Based on the graph, which statement BEST describes aging trends in the United States? 40% 30% 20% 10% 0% JANE Age Groups in the United States 20 to 44 years old 5 to 19 years old Under 5 years old 1860 45 to 64 years old 65 years old and over 1880 1900 1920 1940 1960 1980 2000 2010, In general, the American population is getting younger. The proportion of 5 to 19 year-olds has remained relatively stable for the past 150 years. Seniors make up more of the population now than they have at any time over the past 150 years. Americans today have more children than they did 100 years ago.
Step by Step Solution
3.39 Rating (155 Votes )
There are 3 Steps involved in it
a In general the American population is getting younger ... View full answer

Get step-by-step solutions from verified subject matter experts