

Question: Based on the indicated matunities listed in the table, suppose you have the following yields for Government of Canada bonds: Maturity (Years) 1 5 10
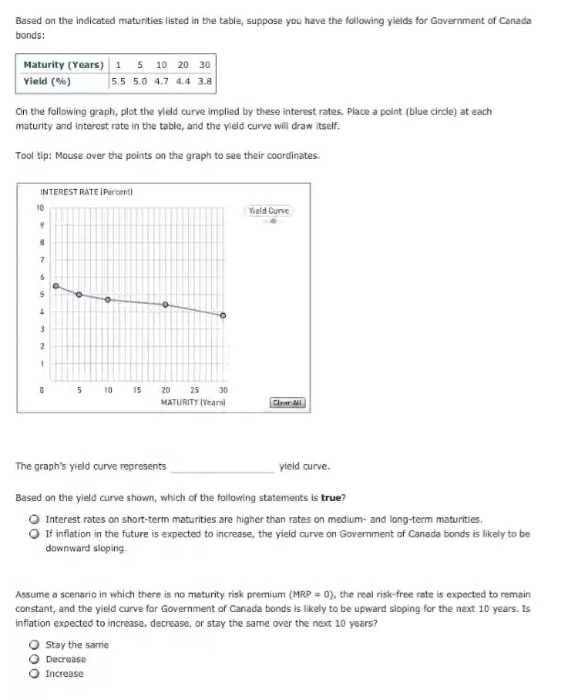
Based on the indicated matunities listed in the table, suppose you have the following yields for Government of Canada bonds: Maturity (Years) 1 5 10 20 30 Yield (%) 5.5 5.0 4.7 4.4 3.8 On the following graph, plot the yield curve implied by these interest rates. Place a point (blue circle) at each maturity and interest rate in the table, and the vield curve will draw itself. Tool tip: Mouse over the points on the graph to see their coordinates. INTEREST RATE [Percent 10 Yield Curve 0 5 10 2025 30 MATURTY I reara The graph's yield curve represents yield curve Based on the yield curve shown, which of the following statements is true? O Interest rates on short-term maturities are higher than rates on medium- and long-term maturities. O If inflation in the future is expected to increase, the yield curve on Government of Canada bonds is likely to be downward sloping. Assume a scenario in which there is no maturity risk premium (MRP 0), the real risk-free rate is expected to remain constant, and the yieid curve for Government of Canada bonds is likely to be upward sloping for the next 10 years. Is inflation expected to increase, decrease, or stay the same over the next 10 yearsi O Stay the same O Decrease O Increase
Step by Step Solution
There are 3 Steps involved in it

Get step-by-step solutions from verified subject matter experts