

Question: based on the information below: Describe the data sources and the methodology you used to test UIP and explain how you collected and analyzed data,

![[1] Standard Errors assume that the covariance matrix of the errors is](https://s3.amazonaws.com/si.experts.images/answers/2024/09/66dbef205dc4e_63166dbef1ff4014.jpg)
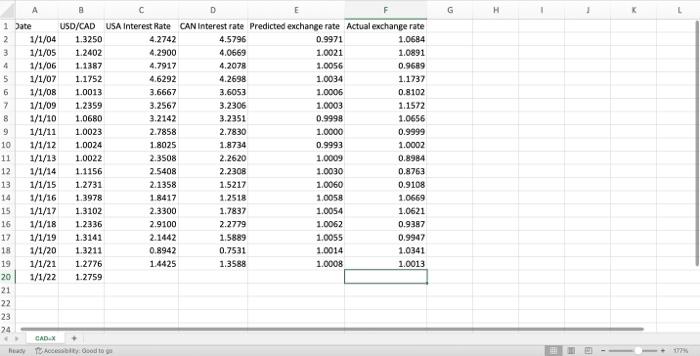
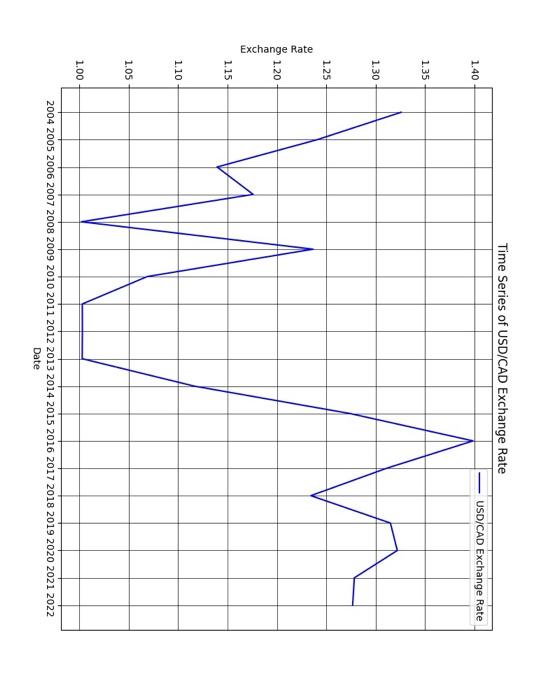
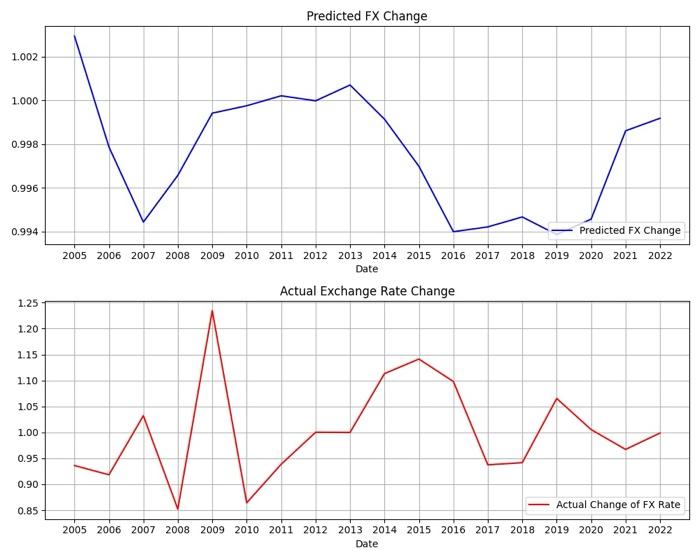
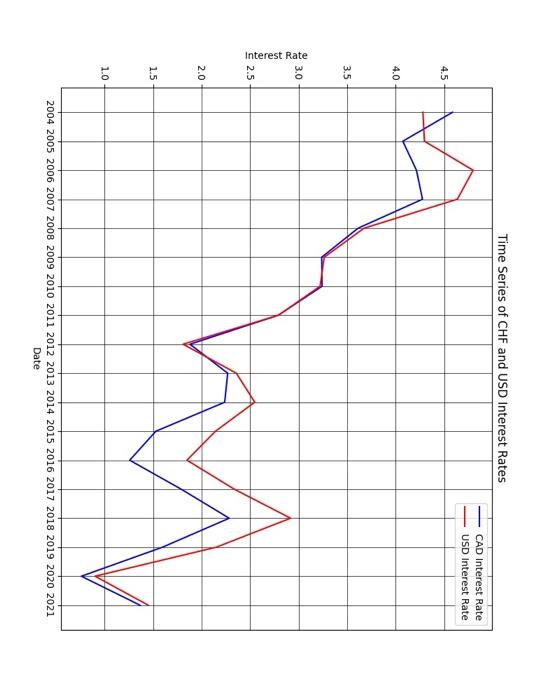
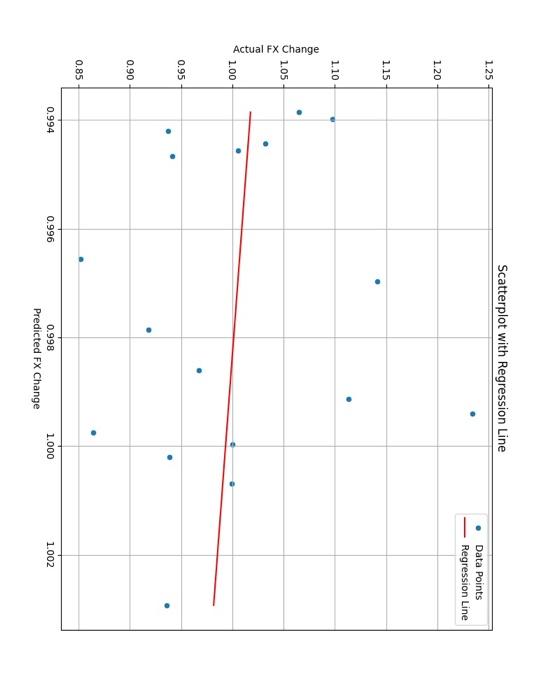
OLS Regression Results Notes : [1] Standard Errors assume that the covariance matrix of the errors is correctly specified. Time Series of USD/CAD Exchange Rate Actual Exchange Rate Change Actual Exchange Rate Change \begin{tabular}{|c|c|c|c|c|c|c|c|c|c|c|c|} \hline A & a & c & D & E & F & G & H & 1 & 1 & K & t \\ \hline 1 Jate & USO/CAD & USA Interest Rate & CAN interest rate & Predicted exchange rate & Actual exchange rate & & & & & & \\ \hline 1/1/04 & 1.3250 & 4.2742 & 4.5796 & 0.9971 & 1.0684 & & & & & & \\ \hline 1/1/05 & 1.2402 & 4.2900 & 4.0669 & 1.0021 & 1.0891 & & & & & & \\ \hline 1/1/06 & 1.1387 & 4.7917 & 4.2078 & 1.0056 & 0.9689 & & & & & & \\ \hline 1/1/07 & 1.1752 & 4.6292 & 4.2698 & 1.0034 & 1.1737 & & & & & & \\ \hline 1/1/08 & 1.0013 & 3.6667 & 3.6053 & 1.0006 & 0.8102 & & & & & & \\ \hline 1/1/09 & 1.2359 & 3.2567 & 3.2306 & 1.0003 & 1.1572 & & & & & & \\ \hline 1/1/10 & 1.0680 & 3.2142 & 3.2351 & 0.9998 & 1.0656 & & & & & & \\ \hline 1/1/11 & 1.0023 & 2.7858 & 2.7830 & 1.0000 & 0.9999 & & & & & & \\ \hline 1/1/12 & 1.0024 & 1.8025 & 1.8734 & 0.9993 & 1.0002 & & & & & & \\ \hline 1/1/13 & 1.0022 & 2.3508 & 2.2620 & 1.0009 & 0.8984 & & & & & & \\ \hline 1/1/14 & 1.1156 & 2.5408 & 2.2308 & 1.0030 & 0.8763 & & & & & & \\ \hline 1/1/15 & 1.2731 & 2.1358 & 1.5217 & 1.0060 & 0.9108 & & & & & & \\ \hline 1/1/16 & 1.3978 & 1.8417 & 1.2518 & 1.0058 & 1.0669 & & & & & & \\ \hline 1/1/17 & 1.3102 & 2.3300 & 1.7837 & 1.0054 & 1.0621 & & & & & & \\ \hline 1/1/18 & 1.2336 & 2.9100 & 2.2779 & 1.0062 & 0.9387 & & & & & & \\ \hline 1/1/19 & 1.3141 & 2.1442 & 1,5889 & 1.0055 & 0.9947 & & & & & & \\ \hline 1/1/20 & 1.3211 & 0.8942 & 0.7531 & 1.0014 & 1.0341 & & & & & & \\ \hline 1/1/21 & 1.2776 & 1.4425 & 1.3588 & 1.0008 & 1.0013 & & & & & & \\ \hline 1/1/22 & 1.2759 & & & & & & & & & & \\ \hline 1 & & & & & & & & & & & \\ \hline 2 & & & & & & & & & & & \\ \hline 3 & & & & & & & & & & & \\ \hline \end{tabular} Scatterplot with Regression Line OLS Regression Results Notes : [1] Standard Errors assume that the covariance matrix of the errors is correctly specified. Time Series of USD/CAD Exchange Rate Actual Exchange Rate Change Actual Exchange Rate Change \begin{tabular}{|c|c|c|c|c|c|c|c|c|c|c|c|} \hline A & a & c & D & E & F & G & H & 1 & 1 & K & t \\ \hline 1 Jate & USO/CAD & USA Interest Rate & CAN interest rate & Predicted exchange rate & Actual exchange rate & & & & & & \\ \hline 1/1/04 & 1.3250 & 4.2742 & 4.5796 & 0.9971 & 1.0684 & & & & & & \\ \hline 1/1/05 & 1.2402 & 4.2900 & 4.0669 & 1.0021 & 1.0891 & & & & & & \\ \hline 1/1/06 & 1.1387 & 4.7917 & 4.2078 & 1.0056 & 0.9689 & & & & & & \\ \hline 1/1/07 & 1.1752 & 4.6292 & 4.2698 & 1.0034 & 1.1737 & & & & & & \\ \hline 1/1/08 & 1.0013 & 3.6667 & 3.6053 & 1.0006 & 0.8102 & & & & & & \\ \hline 1/1/09 & 1.2359 & 3.2567 & 3.2306 & 1.0003 & 1.1572 & & & & & & \\ \hline 1/1/10 & 1.0680 & 3.2142 & 3.2351 & 0.9998 & 1.0656 & & & & & & \\ \hline 1/1/11 & 1.0023 & 2.7858 & 2.7830 & 1.0000 & 0.9999 & & & & & & \\ \hline 1/1/12 & 1.0024 & 1.8025 & 1.8734 & 0.9993 & 1.0002 & & & & & & \\ \hline 1/1/13 & 1.0022 & 2.3508 & 2.2620 & 1.0009 & 0.8984 & & & & & & \\ \hline 1/1/14 & 1.1156 & 2.5408 & 2.2308 & 1.0030 & 0.8763 & & & & & & \\ \hline 1/1/15 & 1.2731 & 2.1358 & 1.5217 & 1.0060 & 0.9108 & & & & & & \\ \hline 1/1/16 & 1.3978 & 1.8417 & 1.2518 & 1.0058 & 1.0669 & & & & & & \\ \hline 1/1/17 & 1.3102 & 2.3300 & 1.7837 & 1.0054 & 1.0621 & & & & & & \\ \hline 1/1/18 & 1.2336 & 2.9100 & 2.2779 & 1.0062 & 0.9387 & & & & & & \\ \hline 1/1/19 & 1.3141 & 2.1442 & 1,5889 & 1.0055 & 0.9947 & & & & & & \\ \hline 1/1/20 & 1.3211 & 0.8942 & 0.7531 & 1.0014 & 1.0341 & & & & & & \\ \hline 1/1/21 & 1.2776 & 1.4425 & 1.3588 & 1.0008 & 1.0013 & & & & & & \\ \hline 1/1/22 & 1.2759 & & & & & & & & & & \\ \hline 1 & & & & & & & & & & & \\ \hline 2 & & & & & & & & & & & \\ \hline 3 & & & & & & & & & & & \\ \hline \end{tabular} Scatterplot with Regression Line
Step by Step Solution
There are 3 Steps involved in it

Get step-by-step solutions from verified subject matter experts