

Question: Based on the information provided in the case, estimate the cost of debt and the cost of equity for Dragon Air. Explain and justify how
Based on the information provided in the case, estimate the cost of debt and the cost of equity for Dragon Air. Explain and justify how you arrived at those estimates.
If publicly traded debt, use that ratio.
Check for a very close competitor
Check capital market information on debt (ie long term short term risk-free rates). Make a judgment there!
If capital markets are used then an additional risk premium for a similar bond grade company should be added on top of the risk-free rate. 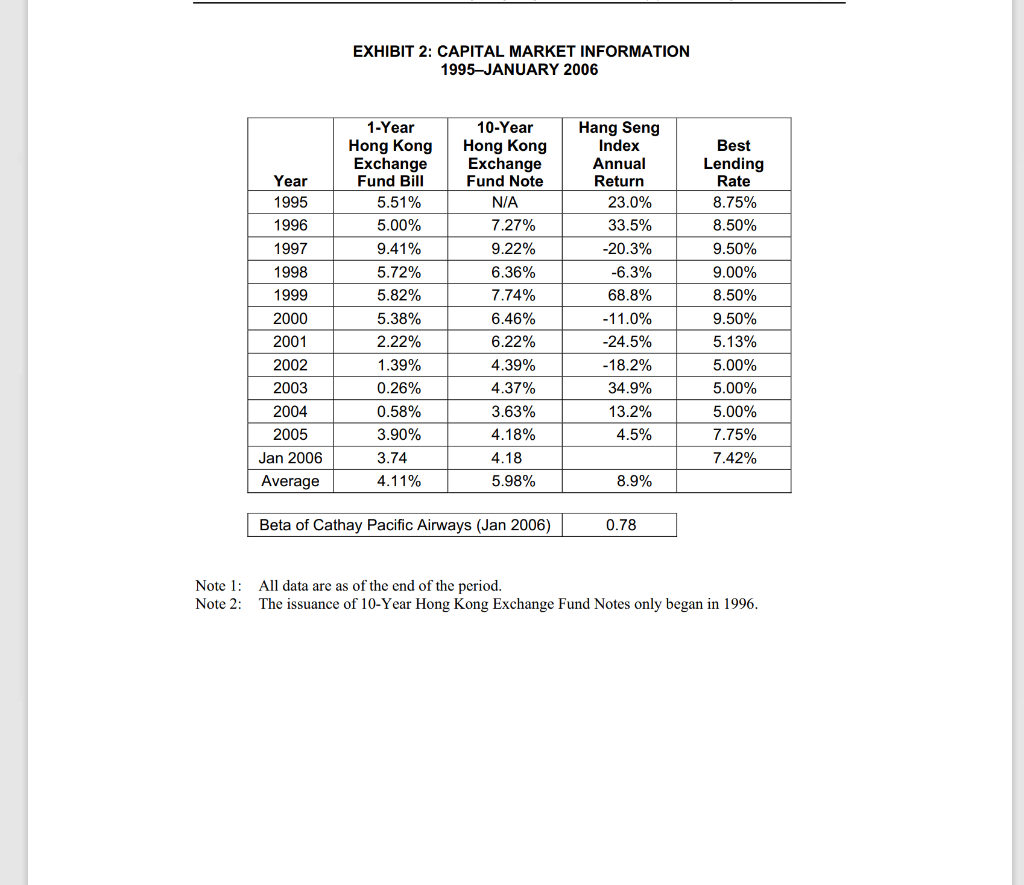
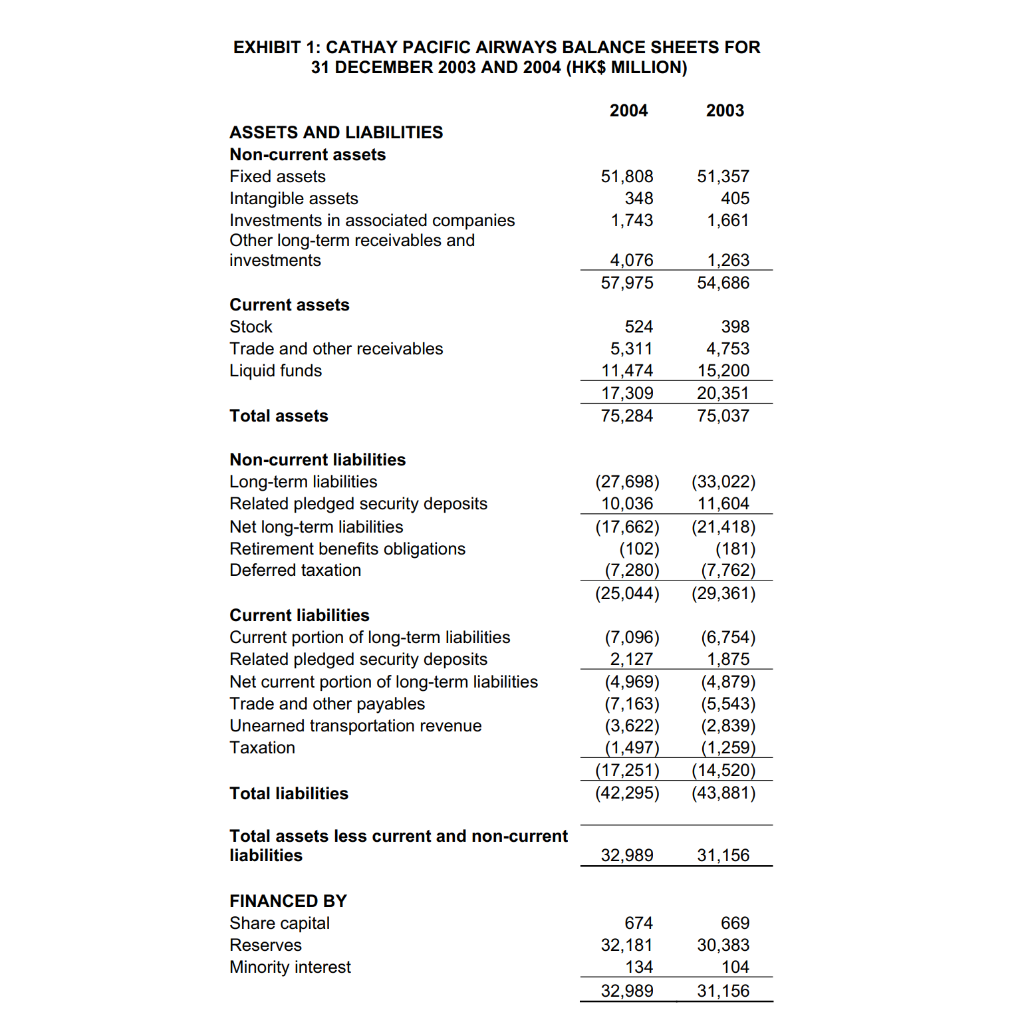
EXHIBIT 2: CAPITAL MARKET INFORMATION 1995JANUARY 2006 Year 1995 1996 1997 1998 1999 2000 2001 2002 2003 1-Year Hong Kong Exchange Fund Bill 5.51% 5.00% 9.41% 5.72% 5.82% 5.38% 2.22% 1.39% 0.26% 0.58% 3.90% 3.74 4.11% 10-Year Hong Kong Exchange Fund Note N/A 7.27% 9.22% 6.36% 7.74% 6.46% 6.22% 4.39% 4.37% 3.63% 4.18% 4.18 5.98% Hang Seng Index Annual Return 23.0% 33.5% -20.3% -6.3% 68.8% -11.0% -24.5% -18.2% 34.9% 13.2% 4.5% Best Lending Rate 8.75% 8.50% 9.50% 9.00% 8.50% 9.50% 5.13% 5.00% 5.00% 5.00% 7.75% 7.42% 2004 2005 Jan 2006 Average 8.9% Beta of Cathay Pacific Airways (Jan 2006) 0.78 Note 1: All data are as of the end of the period. Note 2: The issuance of 10-Year Hong Kong Exchange Fund Notes only began in 1996. EXHIBIT 1: CATHAY PACIFIC AIRWAYS BALANCE SHEETS FOR 31 DECEMBER 2003 AND 2004 (HK$ MILLION) 2004 2003 ASSETS AND LIABILITIES Non-current assets Fixed assets Intangible assets Investments in associated companies Other long-term receivables and investments 51,808 348 1,743 51,357 405 1,661 4,076 57,975 1,263 54,686 Current assets Stock Trade and other receivables Liquid funds 524 5,311 11,474 17,309 75,284 398 4,753 15,200 20,351 75,037 Total assets Non-current liabilities Long-term liabilities Related pledged security deposits Net long-term liabilities Retirement benefits obligations Deferred taxation (27,698) 10,036 (17,662) (102) (7,280) (25,044) (33,022) 11,604 (21,418) (181) (7,762) (29,361) Current liabilities Current portion of long-term liabilities Related pledged security deposits Net current portion of long-term liabilities Trade and other payables Unearned transportation revenue Taxation (7,096) 2,127 (4,969) (7,163) (3,622) (1,497) (17,251) (42,295) (6,754) 1,875 (4,879) (5,543) (2,839) (1,259) (14,520) (43,881) Total liabilities Total assets less current and non-current liabilities 32,989 31,156 FINANCED BY Share capital Reserves Minority interest 674 32,181 134 32,989 669 30,383 104 31,156 EXHIBIT 2: CAPITAL MARKET INFORMATION 1995JANUARY 2006 Year 1995 1996 1997 1998 1999 2000 2001 2002 2003 1-Year Hong Kong Exchange Fund Bill 5.51% 5.00% 9.41% 5.72% 5.82% 5.38% 2.22% 1.39% 0.26% 0.58% 3.90% 3.74 4.11% 10-Year Hong Kong Exchange Fund Note N/A 7.27% 9.22% 6.36% 7.74% 6.46% 6.22% 4.39% 4.37% 3.63% 4.18% 4.18 5.98% Hang Seng Index Annual Return 23.0% 33.5% -20.3% -6.3% 68.8% -11.0% -24.5% -18.2% 34.9% 13.2% 4.5% Best Lending Rate 8.75% 8.50% 9.50% 9.00% 8.50% 9.50% 5.13% 5.00% 5.00% 5.00% 7.75% 7.42% 2004 2005 Jan 2006 Average 8.9% Beta of Cathay Pacific Airways (Jan 2006) 0.78 Note 1: All data are as of the end of the period. Note 2: The issuance of 10-Year Hong Kong Exchange Fund Notes only began in 1996. EXHIBIT 1: CATHAY PACIFIC AIRWAYS BALANCE SHEETS FOR 31 DECEMBER 2003 AND 2004 (HK$ MILLION) 2004 2003 ASSETS AND LIABILITIES Non-current assets Fixed assets Intangible assets Investments in associated companies Other long-term receivables and investments 51,808 348 1,743 51,357 405 1,661 4,076 57,975 1,263 54,686 Current assets Stock Trade and other receivables Liquid funds 524 5,311 11,474 17,309 75,284 398 4,753 15,200 20,351 75,037 Total assets Non-current liabilities Long-term liabilities Related pledged security deposits Net long-term liabilities Retirement benefits obligations Deferred taxation (27,698) 10,036 (17,662) (102) (7,280) (25,044) (33,022) 11,604 (21,418) (181) (7,762) (29,361) Current liabilities Current portion of long-term liabilities Related pledged security deposits Net current portion of long-term liabilities Trade and other payables Unearned transportation revenue Taxation (7,096) 2,127 (4,969) (7,163) (3,622) (1,497) (17,251) (42,295) (6,754) 1,875 (4,879) (5,543) (2,839) (1,259) (14,520) (43,881) Total liabilities Total assets less current and non-current liabilities 32,989 31,156 FINANCED BY Share capital Reserves Minority interest 674 32,181 134 32,989 669 30,383 104 31,156
Step by Step Solution
There are 3 Steps involved in it

Get step-by-step solutions from verified subject matter experts