

Question: Based on the sampling done, the control limits for 3 -sigma x chart are (round a intemedlate calculations to three decimal pioces before proceeding with
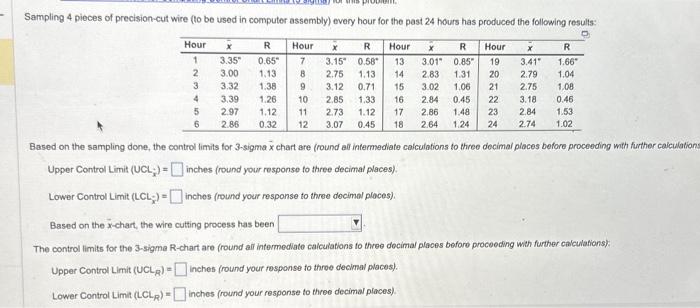
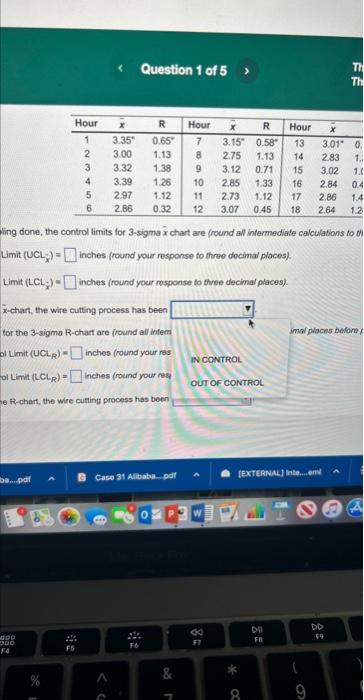
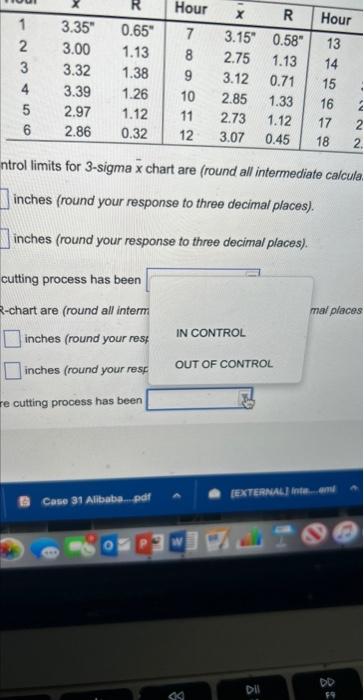
Based on the sampling done, the control limits for 3 -sigma x chart are (round a intemedlate calculations to three decimal pioces before proceeding with further calc Upper Control Limit (UCL- UCx ) = inches (round your response fo three decimal places). Lower Control Limit (LCL)=inches (round your response to thee decimal ploces). Based on the x-chart, the wire cutting process has been The control limits for the 3-sigme R-chart are (round aif intermediate caiculations to three docimal places before proceeding with further calculations): Upper Control Limit (UCLR ) = inches (round your response to throe decimal places). Lower Control Limit (LCLR)= inches (round your response to three decimal places). ling done, the control limits for 3-sigma x chart are fround an intermediate calculabions to th Limit (UCLx)=inches (round your response fo three docimal places). Limit (LCL)=inches (round your response to three decimal places). X-chart, the wire cutling process has been for the 3-sigma R-chart are fround all infeem oimit (LCLR)= inches (round your res ol Limit (LR)= inches (round your res4 1e R-chart, the wire cutting process has been ntrol limits for 3-sigma x chart are (round all intermediate calcula inches (round your response to three decimal places). inches (round your response to three decimal places). cutting process has been R-chart are (round all interm inches (round your res; inches (round your resf
Step by Step Solution
There are 3 Steps involved in it

Get step-by-step solutions from verified subject matter experts