

Question: Based on the sampling done, the control limits for 3-sigma x overbarx chart are (round all intermediate calculations to three decimal places before proceeding with
Based on the sampling done, the control limits for 3-sigma x overbarx chart are (round all intermediate calculations to three decimal places before proceeding with furthercalculations): Upper Control Limit (UCL Subscript x overbarUCLx) = ? Lower Control Limit (LCL Subscript x overbarLCLx) = ? Based on the x overbarx-chart, the wire cutting process has been IN CONTROL or OUT OF CONTROL?
The control limits for the 3-sigma R-chart are (round all intermediate calculations to three decimal places before proceeding with further calculations): Upper Control Limit (UCL Subscript Upper RUCLR) = ? Lower Control Limit (LCL Subscript Upper RLCLR) = ? Based on the R-chart, the wire cutting process has been IN CONTROL or OUT OF CONTROL ?
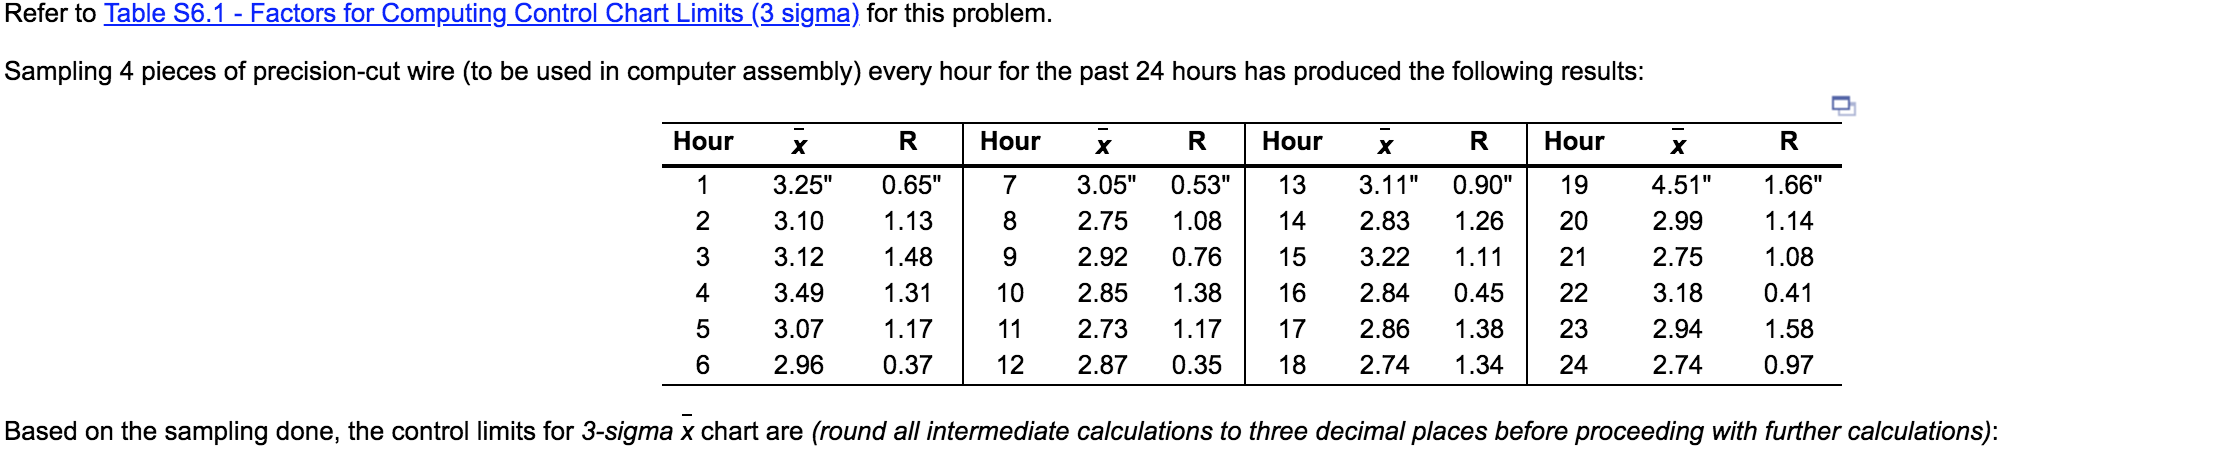
Refer to Table 56.1 - Factors for Computing Control Chart Limits (3 sigma) for this problem. Sampling 4 pieces of precision-cut wire (to be used in computer assembly) every hour for the past 24 hours has produced the following results: Hour R 0.65" 1.13 Hour 7 Hour 19 20 3.25" 3.10 3.12 3.49 3.07 2.96 1.48 9 3.05" 2.75 2.92 2.85 2.73 2.87 R 0.53" 1.08 0.76 1.38 1.17 0.35 OWN- Hour 133.11" 2.83 3.22 2.84 17 2.86 18 2.74 R 0.90" | 1.26 1.11 0.45 1.38 1.34 21 X 4.51" 2.99 - 2.75 3.18 2.94 2.74 R 1.66" 1.14 1.08 0.41 1.58 0.97 | 22 1.31 1.17 0.37 11 12 23 24 Based on the sampling done, the control limits for 3-sigma x chart are (round all intermediate calculations to three decimal places before proceeding with further calculations)Step by Step Solution
There are 3 Steps involved in it

Get step-by-step solutions from verified subject matter experts