

Question: Based on the sampling done, the control limits for 3-sigma x overbarx chart are (round all intermediate calculations to three decimal places before proceeding with
Based on the sampling done, the control limits for 3-sigma x overbarx chart are (round all intermediate calculations to three decimal places before proceeding with furthercalculations): Upper Control Limit (UCL Subscript x overbarUCLx) = ? Lower Control Limit (LCL Subscript x overbarLCLx) = ? Based on the x overbarx-chart, the wire cutting process has been IN CONTROL or OUT OF CONTROL?
The control limits for the 3-sigma R-chart are (round all intermediate calculations to three decimal places before proceeding with further calculations): Upper Control Limit (UCL Subscript Upper RUCLR) = ? Lower Control Limit (LCL Subscript Upper RLCLR) = ? Based on the R-chart, the wire cutting process has been IN CONTROL or OUT OF CONTROL ?
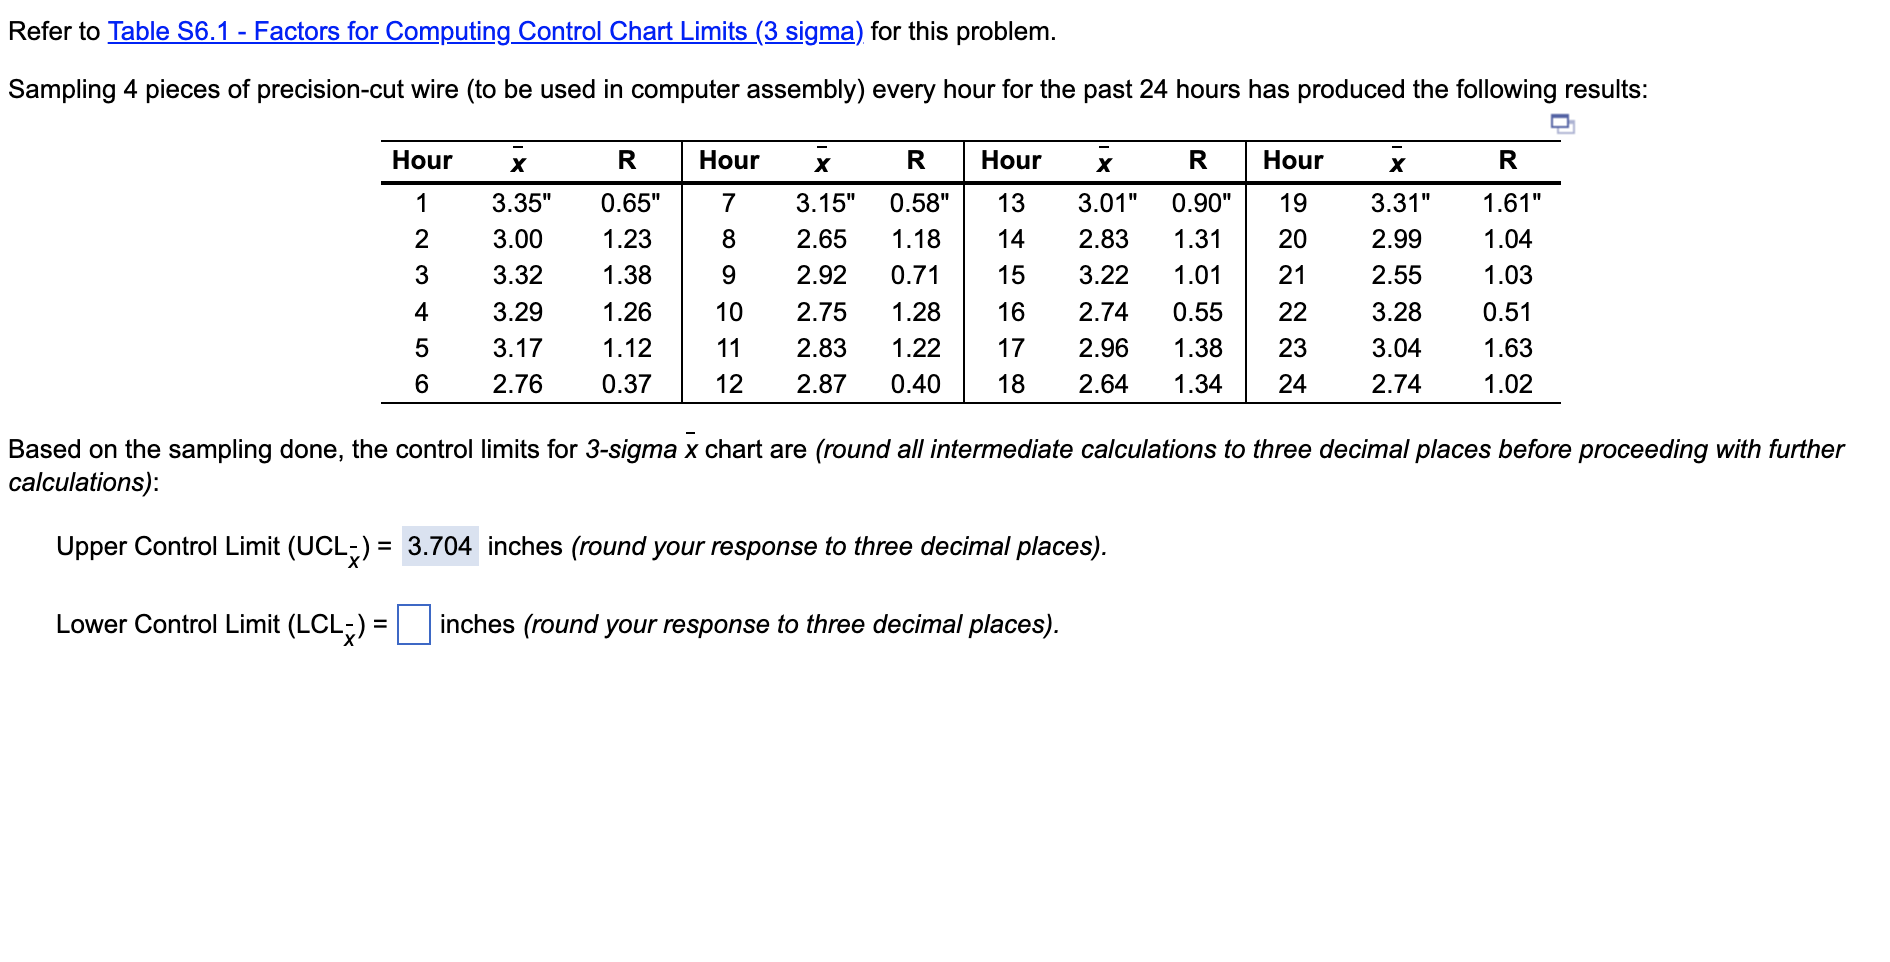
Refer to Table S6.1 - Factors for Computing Control Chart Limits (3 sigma) for this problem. Sampling 4 pieces of precision-cut wire (to be used in computer assembly) every hour for the past 24 hours has produced the following results: Hour R Hour R Hour R Hour R 1 7 19 2 0.65" 1.23 1.38 8 20 3 3.35" 3.00 3.32 3.29 3.17 2.76 3.15" 2.65 2.92 2.75 2.83 2.87 0.58" 1.18 0.71 1.28 1.22 0.40 9 10 11 12 13 14 15 16 17 18 3.01" 2.83 3.22 2.74 2.96 2.64 0.90" 1.31 1.01 0.55 1.38 1.34 3.31" 2.99 2.55 3.28 3.04 2.74 4 1.61" 1.04 1.03 0.51 1.63 1.02 21 22 23 24 1.26 1.12 0.37 5 6 Based on the sampling done, the control limits for 3-sigma x chart are (round all intermediate calculations to three decimal places before proceeding with further calculations): Upper Control Limit (UCL;) = 3.704 inches (round your response to three decimal places). = = Lower Control Limit (LCL) = inches (round your response to three decimal places)Step by Step Solution
There are 3 Steps involved in it

Get step-by-step solutions from verified subject matter experts