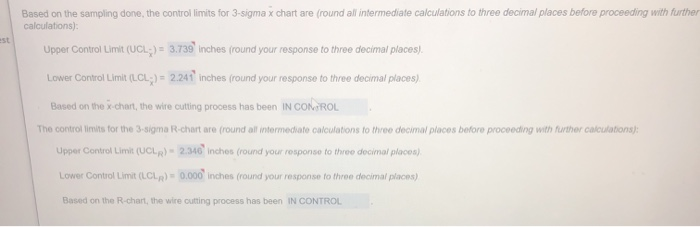
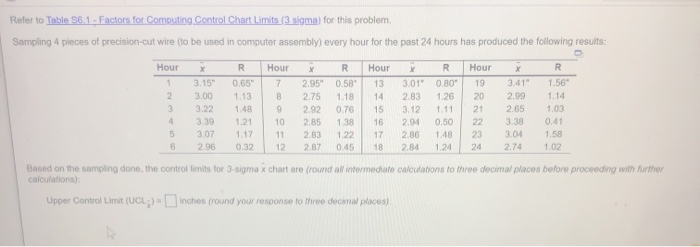
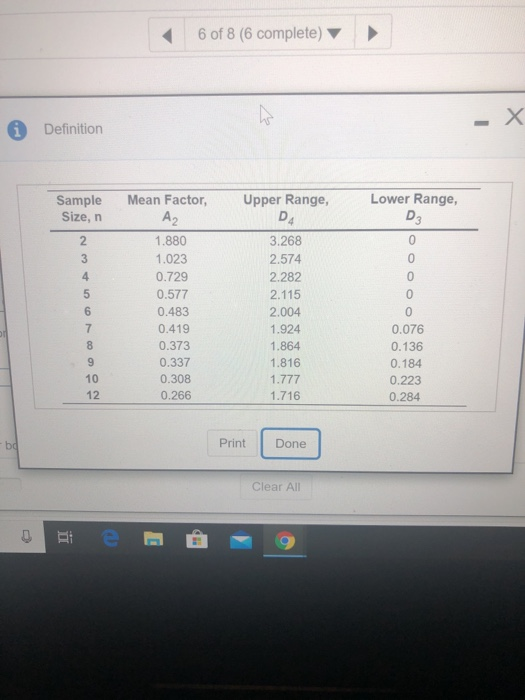
Question: Based on the sampling done, the controllimits for 3-sigmax chart are (round all intermediate calculations to three decimal places before proceeding with further calculations): Upper

Based on the sampling done, the controllimits for
Based on the sampling done, the controllimits for 3-sigmax chart are (round all intermediate calculations to three decimal places before proceeding with further calculations): Upper Control Limit (UCL) = 3.739 inches (round your response to three decimal places) Lower Control Limit (LCL) = 2.241 inches (round your response to three decimal places) Based on the x-chart, the wire cutting process has been IN COMROL The controllimits for the 3-sigma R-chart are (round all intermediate calculations to three decimal places before proceeding with further calculations): Upper Control Limit (UCL) 2.340 inches (round your response to three decimal places) Lower Control Limit (LCL) 0.000 inches (round your response to three decimal places) Based on the R-chart, the wire cutting process has been IN CONTROL Refer to Table 56.1 - Factors for Computing Control Chart Limits (3 sigma) for this problem, Sampling 4 pieces of precision-cut wire to be used in computer assembly) every hour for the past 24 hours has produced the following results: Hour 1 2 3 4 5 6 X R Hour R Hour X R 3 .15" 0.65" 7 2.95" 0.58 13 3.01" 0.80' 3.00 1.138 2.75 1.1814 2.831 .26 3221439 2.9 0.76 15 3.12 1.11 3.39 1.21 102.85 138 16 2.94 0.50 3.07 117 11233 122 17 2.86 1.48 2.96 0.32 122.87 0.45 18 2.84 1.24 Hour X 193.41" 202.99 212.65 22 3.38 23 304 24 2.74 R 1.56 1.14 1.03 0.41 1.58 1.02 Based on the sampling done, the controllimits for 3-sigma x chart are (round all intermediate calculations to three decimal places before proceeding with further calculations): Upper Control Limit (UCL) inches (round your response to three decimal places) 6 of 8 (6 complete) Definition Mean Factor, Upper Range, Lower Range, Sample Size, n A2 DA NOWN 1.880 1.023 0.729 0.577 0.483 0.419 0.373 0.337 0.308 0.266 3.268 2.574 2.282 2.115 2.004 1.924 1.864 1.816 1.777 1.716 0.076 0.136 0.184 0.223 0.284 Print Done Clear All

Step by Step Solution

There are 3 Steps involved in it

1 Expert Approved Answer
Step: 1 Unlock blur-text-image
Question Has Been Solved by an Expert!

Get step-by-step solutions from verified subject matter experts

Step: 2 Unlock
Step: 3 Unlock

Students Have Also Explored These Related General Management Questions!