

Question: Based on the x -chart, is one or more samples beyond the control limits? Based on the R-chart, is one or more samples beyond the
 Based on the x-chart, is one or more samples beyond the control limits?
Based on the R-chart, is one or more samples beyond the control limits?
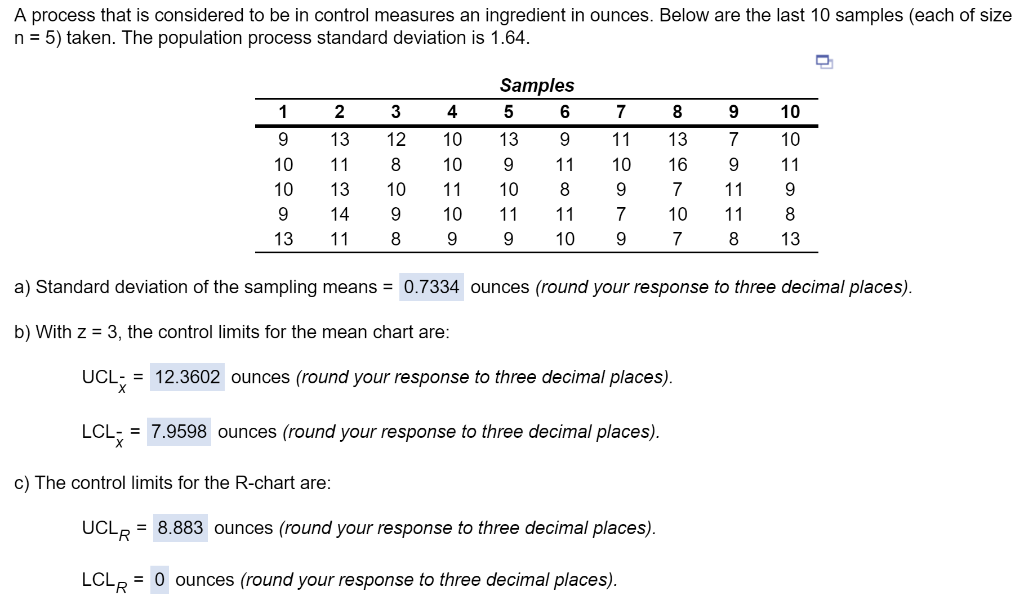
A process that is considered to be in control measures an ingredient in ounces. Below are the last 10 samples (each of size n = 5) taken. The population process standard deviation is 1.64. U Samples 5 6 1 2. 4 7 8 9 10 3 12 9 13 10 9 11 7 10 10 10 9 11 13 10 9 13 8 10 9 13 9 10 11 9 11 10 9 11 8 11 10 10 9 7 9 13 16 7 10 7 14 11 9 8 11 11 8 11 8 13 a) Standard deviation of the sampling means = 0.7334 ounces (round your response to three decimal places). b) With z = 3, the control limits for the mean chart are: UCLE = 12.3602 ounces (round your response to three decimal places). LCL = = 7.9598 ounces (round your response to three decimal places). c) The control limits for the R-chart are: UCLR = 8.883 ounces (round your response to three decimal places). LCLR = 0 ounces (round your response to three decimal places)Step by Step Solution
There are 3 Steps involved in it
1 Expert Approved Answer
Step: 1 Unlock

Question Has Been Solved by an Expert!
Get step-by-step solutions from verified subject matter experts
Step: 2 Unlock
Step: 3 Unlock