

Question: Refer to Table S 6 . 1 - Factors for Computing Control Chart Limits ( 3 sigma ) for this problem. Twelve samples, each containing
Refer to Table S Factors for Computing Control Chart Limits sigma for this problem.
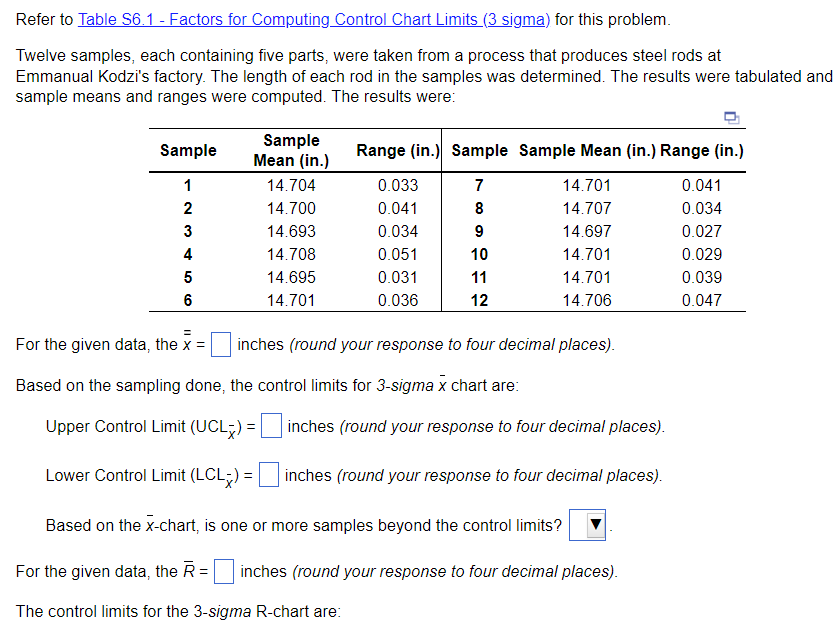
Twelve samples, each containing five parts, were taken from a process that produces steel rods at
Emmanual Kodzi's factory. The length of each rod in the samples was determined. The results were tabulated and recorded:
For the given data, the x double overbar
enter your response here inches round your response to four decimal places
Part
Based on the sampling done, the control limits for sigma x overbar chart are:
Upper Control Limit UCL Subscript x overbar
enter your response here inches round your response to four decimal places
Part
Lower Control Limit LCL Subscript x overbar
enter your response here inches round your response to four decimal places
Part
Based on the x overbarchart, is one or more samples beyond the control limits
Yes
No
Part
For the given data, the Upper R overbar
enter your response here inches round your response to four decimal places
Part
The control limits for the sigma Rchart are:
Part
Upper Control Limit UCL Subscript Upper R
enter your response here inches round your response to four decimal places
Part
Lower Control Limit LCL Subscript Upper R
enter your response here inches round your response to four decimal places
Part
Based on the Rchart, is one or more samples beyond the control limits
No
Yes
Step by Step Solution
There are 3 Steps involved in it
1 Expert Approved Answer
Step: 1 Unlock

Question Has Been Solved by an Expert!
Get step-by-step solutions from verified subject matter experts
Step: 2 Unlock
Step: 3 Unlock