Question: Based on these data, what interventions could Tanglewood, as a whole, initiate to improve their retention figures? Pay specific attention to the major sources of
-
Based on these data, what interventions could Tanglewood, as a whole, initiate to improve their retention figures? Pay specific attention to the major sources of turnover identified in the data, as well as the factors listed in Staffing Organizations, Chapter 14 that are related to turnover but that might not currently be measured by Tanglewood. Your suggestions should be in the form of a memo from staffing services to the corporate offices.
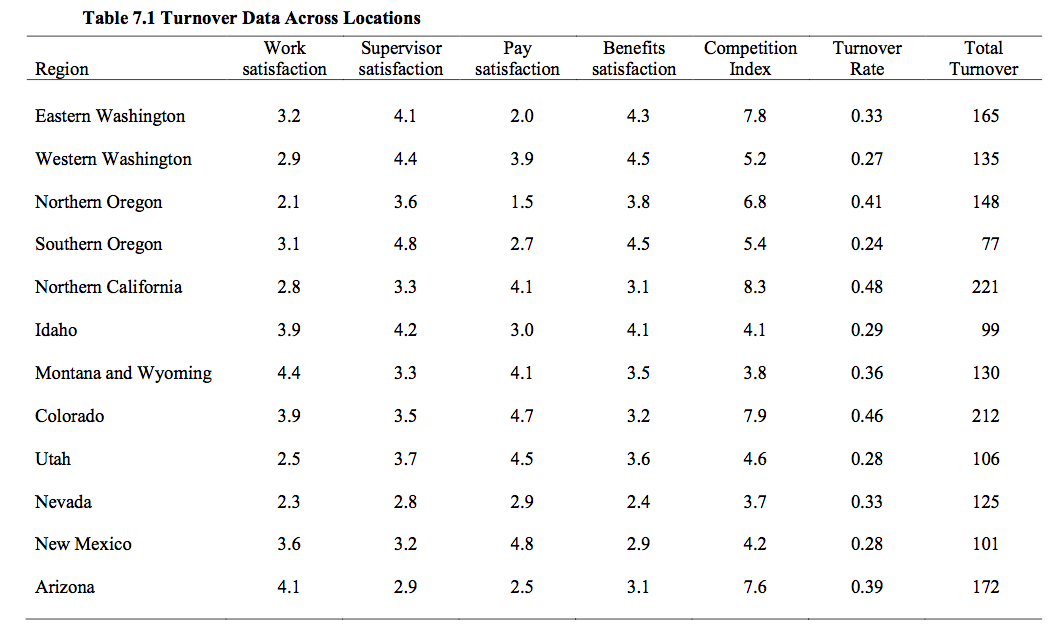
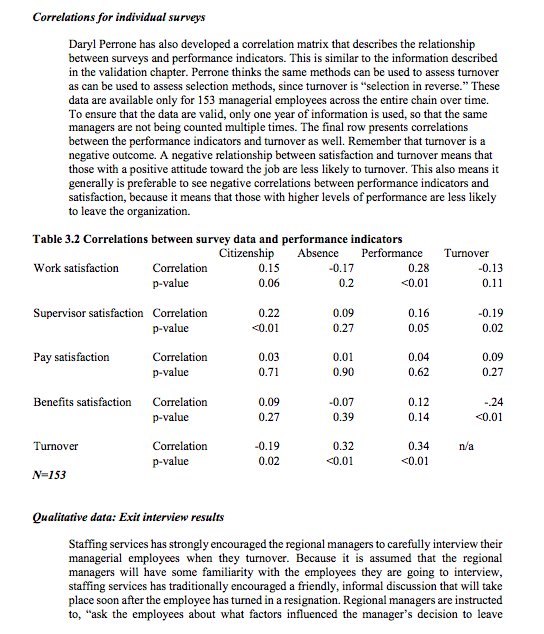
The Situation As you may have noticed when analyzing the transition probability matrix in the planning exercise, there was a 34% annual turnover rate among store managers and assistant store managers in Washington during the past year. This is an unacceptably high number from Tanglewood's point of view. Such high levels of turnover are likely to create a feeling of instability among lower level employees, and generally indicate that the organization will have difficulty creating effective long-term goals in these stores. Unfortunately, this high turnover among managerial employees is even more problematic because of the costs involved. Managerial survey is a very sensitive issue for Tanglewood. The process of finding good managers obviously begins with recruiting. A very large number of individuals must be found during the recruiting phase, because, as you saw in case 4, only 11% of external applicants are selected to become assistant store managers and only 10% of external applicants are selected to become store managers. After hiring, every manager, regardless of their status as internal or external hires, is put through a two month training program that includes trips to the corporate offices, mentoring from other store managers and the regional manager, and culminating in a public welcoming ceremony at the store where the manager will work. There is a downside to the process of training managers. Excellence in managerial performance is often observable from the outside as well because competitors can walk into the stores and see which ones are functioning well. It is common for particularly successful store managers to receive offers from other companies that are trying to capture some of the Tanglewood "essence." The Employee Satisfaction Survey The Tanglewood employee relations department administered a survey every year to assess the attitudes of employees towards several aspects of their employment. Although the purpose of the survey is to collect baseline information on employee attitudes, Marilyn Gonzalez believes that these survey responses will be an ideal method to track the reasons why some managers are more likely to turnover. The annual employee survey is conducted in June. Boxes of blank surveys are sent to regional managers, who then use central routing to send surveys to each store. The survey was initiated to give employees an opportunity to express their feelings about key topics that Tanglewood thinks will benefit employees. Given the overall organizational culture, it should be clear that employee satisfaction is an important issue. Emerson and Wood send bulk e-mails to all store managers to encourage them to get a 100% response rate from their employees. However, it is common for less than 50% of the employees to complete surveys. An example of the survey is contained in Appendix E. The survey asks questions that can be broken down into four major topics, as follows: Supervisor satisfaction The supervisor satisfaction questions encourage employees to describe their relationship with their immediate supervisor and the extent to which they are satisfied with the direction they receive on a day to day basis. Tanglewood spends a great deal of money training supervisors on the Tanglewood way" so they are especially concerned that these principles are carried out in practice. Regional data Table 7.1 contains summary information from the employee surveys, the competition index, and turnover. Because the most pressing concern is managerial turnover, only data for store managers and assistant managers is displayed. The data is collected by the staffing services division and then summarized across stores for a five-year period. Having this long term aggregated data makes certain that the results are reasonably robust. The competition index is a measure of the number of local businesses that might draw employees from Tanglewood. The scale ranges from 1 to 10, with higher values indicating more competition. Some of the factors that go into the development of the competition index include the number of other retail establishments in the area, the total square feet of retail available, and the number of other Tanglewood stores. This measure was not specifically developed for turnover analysis, but the corporate office believes that it probably is a good indication of the number of alternative organizations that might want to hire Tanglewood's managers. Table 7.1 Turnover Data Across Locations Work Supervisor Region satisfaction satisfaction Pay satisfaction Benefits satisfaction Competition Index Turnover Rate Total Turnover Eastern Washington 3.2 4.1 2.0 4.3 7.8 0.33 165 Western Washington 2.9 4.4 3.9 4.5 5.2 0.27 135 Northern Oregon 2.1 3.6 1.5 3.8 6.8 0.41 148 Southern Oregon 3.1 4.8 2.7 4.5 5.4 0.24 77 Northern California 2.8 3.3 4.1 3.1 8.3 0.48 221 Idaho 3.9 4.2 3.0 4.1 4.1 0.29 99 Montana and Wyoming 4.4 3.3 4.1 3.5 3.8 0.36 130 Colorado 3.9 3.5 4.7 3.2 7.9 0.46 212 Utah 2.5 3.7 4.5 3.6 4.6 0.28 106 Nevada 2.3 2.8 2.9 2.4 3.7 0.33 125 New Mexico 3.6 3.2 4.8 2.9 4.2 0.28 101 Arizona 4.1 2.9 2.5 3.1 7.6 0.39 172 Correlations for individual surveys Daryl Perrone has also developed a correlation matrix that describes the relationship between surveys and performance indicators. This is similar to the information described in the validation chapter. Perrone thinks the same methods can be used to assess turnover as can be used to assess selection methods, since turnover is "selection in reverse." These data are available only for 153 managerial employees across the entire chain over time. To ensure that the data are valid, only one year of information is used, so that the same managers are not being counted multiple times. The final row presents correlations between the performance indicators and turnover as well. Remember that turnover is a negative outcome. A negative relationship between satisfaction and turnover means that those with a positive attitude toward the job are less likely to turnover. This also means it generally is preferable to see negative correlations between performance indicators and satisfaction, because it means that those with higher levels of performance are less likely to leave the organization. Table 3.2 Correlations between survey data and performance indicators Citizenship Absence Performance Turnover Work satisfaction Correlation 0.15 -0.17 0.28 -0.13 p-value 0.06 0.2


